Basic Statistics
There are primarily two branches in which basic statistics are studied:
Descriptive Statistics
Applied to describe the data using numbers, charts, and graphs. Terms such as mean, median, mode, variance, standard deviation are values that summarize data. Descriptive statistics describe the entire group for which the numbers were obtained. These are the actual values for the entire group.
Inferential Statistics
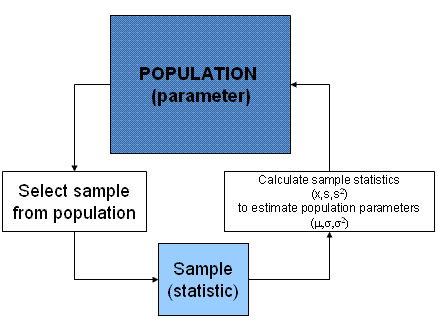
Uses sample statistics to infer relationships of the population parameters. This is most often done in the Analyze and Improve phases using hypothesis testing, correlation analysis, regression analysis, and design of experiments (DOE).
It is rarely possible to analyze the entire population (such as the average weight of all sharks in the ocean). For this reason a sampling strategy is applied. The analysis of the sample is used to apply inferences to the entire population. The values may or may not be the same values for the entire population so they are applied with a confidence interval.

A comparison of means, variance, or proportions is initiated with a hypothesis statement about a population or populations. The sample statistics are studied to determine, with a certain level of confidence and power, that the hypothesis (null hypothesis) is to be proven false or not false but not necessarily true. See Hypothesis Testing for more information.
The links below cover other topics within basic statistics:
Graphical Summaries
Hypothesis Testing
Central Limit Theorem
Analysis of Variance (ANOVA)
"Defect" Metrics
DPU - Defects Per Unit
DPO - Defects Per Opportunity
DPMO - Defects Per Million Opportunities
Process Yield Metrics
FY - Final Yield
TPY - Throughput Yield
RTY - Rolled Throughput Yield
NY - Normalized Yield
The meaning and formula around sigma scores
Z-score
Yield to Sigma Relationships
Process Capability Indices
Distributions:
Shape of the Distribution:
Other topics
SPC - Statistical Process Control
Alpha and Beta Risks (Type I Error and Type II Error)
Comparing Samples vs. Population
Short Term versus Long Term sampling
Measures of Central Tendency: Mean, Median, Mode
Measures of Dispersion: Range, Standard Dev, Variance, Coefficient of Variation
Cumulative Distribution Function
Basic Statistics - Distributions
DISCRETE DISTRIBUTIONS:
CONTINUOUS DISTRIBUTIONS:
A
few other continuous distributions (but are not covered in this
website) are Beta, Cauchy, Gamma, Lognormal, Weibull, Double
Exponential, Power Normal, Bivariate Normal, Power Log Normal,
Triangular, and Tukey-Lambda.
Statistics Evaluation Tools
Templates, Tables, and Calculators
Find a career in Six Sigma - active job postings
Return to the Six-Sigma-Material Home Page

Site Membership
LEARN MORE
Six Sigma
Templates, Tables & Calculators
Six Sigma Slides
Green Belt Program (1,000+ Slides)
Basic Statistics
Cost of Quality
SPC
Control Charts
Process Mapping
Capability Studies
MSA
SIPOC
Cause & Effect Matrix
FMEA
Multivariate Analysis
Central Limit Theorem
Confidence Intervals
Hypothesis Testing
Normality
T Tests
1-Way ANOVA
Chi-Square
Correlation
Regression
Control Plan
Kaizen
MTBF and MTTR
Project Pitfalls
Error Proofing
Z Scores
OEE
Takt Time
Line Balancing
Yield Metrics
Sampling Methods
Data Classification
Practice Exam
... and more


