|

 content.")
Spearman's Rho Correlation Coefficient is also known as Spearman's Rank Coefficient and is named after Charles Spearman (1863-1945), represented by the Greek letter rho.
Similar to Pearson's Correlation Coefficient (r) it is a measure of statistical dependence of two variables in matched pairs. It is a non-parametric test that will also have a value range from -1 to +1 and zero indicating no association.
Formula:
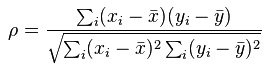
Xi = the rank of the x value in the data set
Yi = the rank of the y value in the data set
See the example lower in the page to see the the x and y data ranked. It is the ranked values that are used as well as their mean (not the mean of the actual data but the ranking position).
- A value of +1 indicates perfectly positive monotonic correlation. All data points with greater x values than that of a given data point will have greater y values.
- A value of 0 indicates no correlation.
- A value of -1 indicates perfectly negative monotonic correlation. All data points with lower x values than that of a given data point will have lower y values.
In other words, a value of +1 indicates that both X and Y increase (or non-decreasing) in a data set throughout the inferred space and a value of -1 is the opposite.
MONOTONIC indicates the relationship has both variables increasing, or non-decreasing, OR has both variables decreasing, or non-increasing, throughout the inferred space.
Recall:
Y = the dependent variable
X = the independent variable
TWO QUALIFICATIONS
- The Spearman's Rho test works with continuous or discrete data of at least the ordinal level so that also includes interval or ratio types but EXCLUDES nominal data. See Data Classification for more information on the types of data.
- And, mentioned above, the two variables must have a monotonic relationship.
If applicable, this calculation is a part of the ANALYZE or IMPROVE phases of a DMAIC project.
How is this different from Pearson's Correlation Coefficient?
This Spearman's Rho test can determine association of non-linear relationships but it has its limitations too. Recall the Pearson's Correlation Coefficient only measure linear correlation.
The Spearman's Rho Correlation Coefficient can provide a perfect correlation value of +1 or -1 when X and Y have a monotonic relationship whereas the Pearson's Correlation Coefficient only gives value of +1 or -1 when there is perfect linear relationship. This is one of the reasons the Spearman's Rho Correlation Coefficient is called non-parametric.
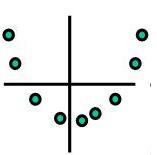
While Spearman's Rho Correlation Coefficient can be more effective in finding a non-linear relationship that Pearson's, it doesn't find relationships that may exist in more complex associations such as parabolic, hyperbolic, or similar to the picture below.
Each calculation should be understood by a GB/BB to be able to explain to the rest of the team exactly what data is saying in a practical sense. Working through a couple calculations from start to finish will help understand their differences.
Before running this calculation or for Pearson's Correlation Coefficient (r) look for any outliers that are special cause and may be eliminated. However, this may not be possible.
Obviously if they are explainable and removable, it will strengthen the value in terms of making it more accurate. The Spearman's Rho Correlation Coefficient calculation is not affected as much by outliers as Pearson's Correlation Coefficient.
In most cases, the Spearman's Rho Correlation Coefficient is about the same value as, or greater than, Pearson's Correlation Coefficient. If you are interested in strictly learning about the LINEAR relationship, use the Pearson's Correlation Coefficient.
Our suggestion is to run both calculations since it is quickly done using statistical software or a calculator. The more information a GB/BB can get with little relative cost is always preferred.
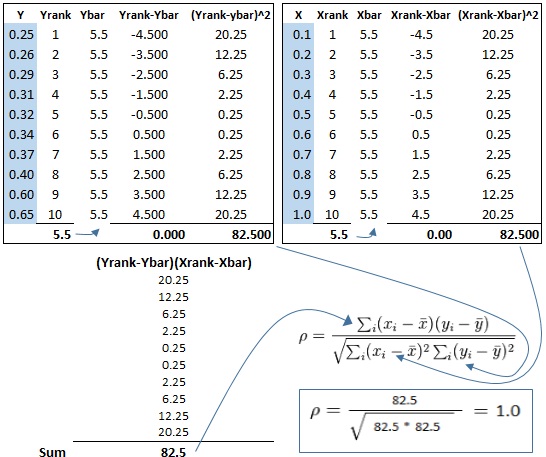
Example
A Black Belt collected the data shaded in blue below. From there, the additional columns were calculated in Excel and filled into the right. Notice the ranking of the data and those values are used in this final calculation.
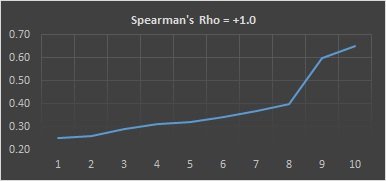
This is a perfectly positive monotonic relationship. Notice that for each value of x that increases, the value of y increases. The graph is shown below.
Creating a template similar to that above can take time but allows a number of scenarios to be analyzed.
CONSIDER:
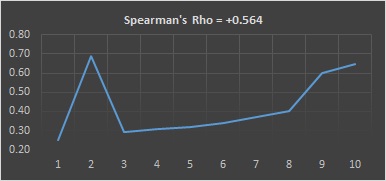
If the 2nd data point y-value was 0.69 instead of 0.26, then its rank in order of the y-values becomes 10 and the others after it change too. See below and look at the difference in the y rankings, the line chart, and the Spearman's Rho Correlation Coefficient.
The yellow shaded cells changed from the previous example (and of course the subsequent calculations that use those values).

Search for Six Sigma related jobs
Return to the Six-Sigma-Material.com Home page
Recent Articles
-
Process Capability Indices
Oct 18, 21 09:32 AM
 Determing the process capability indices, Pp, Ppk, Cp, Cpk, Cpm
 -
Six Sigma Calculator, Statistics Tables, and Six Sigma Templates
Sep 14, 21 09:19 AM
 Six Sigma Calculators, Statistics Tables, and Six Sigma Templates to make your job easier as a Six Sigma Project Manager
 -
Six Sigma Templates, Statistics Tables, and Six Sigma Calculators
Aug 16, 21 01:25 PM
Six Sigma Templates, Tables, and Calculators. MTBF, MTTR, A3, EOQ, 5S, 5 WHY, DPMO, FMEA, SIPOC, RTY, DMAIC Contract, OEE, Value Stream Map, Pugh Matrix -
Six Sigma, Six Sigma Training, Courses, Calculators, Certification
Aug 15, 21 10:27 PM
 One site with the most common Six Sigma material, videos, examples, calculators, courses, and certification.

Site Membership
LEARN MORE
Six Sigma
Templates, Tables & Calculators
Six Sigma Slides
Green Belt Program (1,000+ Slides)
Basic Statistics
Cost of Quality
SPC
Control Charts
Process Mapping
Capability Studies
MSA
SIPOC
Cause & Effect Matrix
FMEA
Multivariate Analysis
Central Limit Theorem
Confidence Intervals
Hypothesis Testing
Normality
T Tests
1-Way ANOVA
Chi-Square
Correlation
Regression
Control Plan
Kaizen
MTBF and MTTR
Project Pitfalls
Error Proofing
Z Scores
OEE
Takt Time
Line Balancing
Yield Metrics
Sampling Methods
Data Classification
Practice Exam
... and more