MEASURE
The 2nd phase of a DMAIC Project.

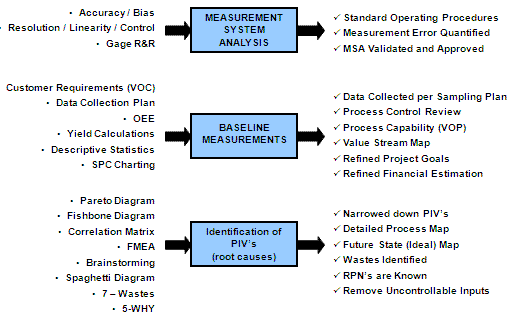
The MEASURE phase involves more numerical studies and data analysis than the DEFINE phase. This phase focuses on measurement system validation and gathering root causes.
The Voice of the Process (VOP) has variation from both the measurement system and the process and all its families (sources) of variation. The MSA will quantify the amount of variation found in the data that is induced from the measurement system.
The next phase, ANALYZE, uses statistical tests to quantify the variation due to the inputs only (separate from the MSA variation).
Many projects stall at this phase; conducting a MSA can be an exhaustive effort. Prepare to buckle down and test your knowledge of basic statistics. Many measurement systems need work or can be improved with simple action, others will require much more and can become a project all by itself.

Refine the Contract/Charter:
In this phase, the problem statement and project contract are commonly refined as a result of establishing an accurate baseline for the metrics being targeted. Without being able to measure, it is impossible to quantify change....furthermore, what gets measured usually gets improved.
Learn the Software:
This phase will most likely introduce statistical software. There's a big advantage to those that are more fluent with the software. Put the time into familiarizing yourself with the statistical software package prior to starting a project. It's highly encouraged to use the HELP menu to your advantage and experiment with mock data.
Data Collection:
Systems with archives of data often have flaws, or the data only occurs infrequently. Data collection takes time from operators and management and can be viewed as a burden.
Finding the balance to get as much information as possible that is proven reliable while not consuming excessive resources is key to success in this phase.
This data collection will often encounter resistance and can lead to the temptation of taking the easier routes, rounding off numbers, or otherwise skewing and creating inaccuracies. Education, awareness, rule setting, and up front discussion with all stakeholders (not just team members) is necessary to get the most cooperation and validity in data collection.
Without taking away from the importance, often times teams cruise through the DEFINE phase then find out that data collection and analysis are very time consuming and challenging.
Shown below are some of the commonly used tools within the MEASURE phase:
Maps
Process Maps
Value Stream Mapping
Data Collection
Data Collection
Data Sampling - Population vs. Sample
Data Classification
SPC
Statistical Process Control (SPC) Charts
MSA
MSA - Measurement System Analysis
Testing Methods (Destructive and Nondestructive)
Gathering Root Causes
Root Cause Analysis
5-WHY
Fishbone Diagram / Ishakawa Diagram / Cause and Effect Diagram
Correlation Matrix
FMEA - Failure Mode Effects and Analysis
A3 Problem Solving Tool
Project Metrics
Establishing a Baseline Measurement
DPU - Defects per Unit
DPO - Defects per Opportunity
DPMO - Defects per Million Opportunities
Z-score - sigma scores (standard deviations from the mean)
Process Yield Metrics
FY - Final Yield
TPY - Throughput Yield
RTY - Rolled Throughput Yield
NY - Normalized Yield
Other Topics
Box Plot (also variable width and notched)
Stem and Leaf Plot
Overall Equipment Effectiveness (OEE)
Proceed to the 3rd phase of a DMAIC project: ANALYZE

Site Membership
LEARN MORE
Six Sigma
Templates, Tables & Calculators
Six Sigma Slides
Green Belt Program (1,000+ Slides)
Basic Statistics
Cost of Quality
SPC
Control Charts
Process Mapping
Capability Studies
MSA
SIPOC
Cause & Effect Matrix
FMEA
Multivariate Analysis
Central Limit Theorem
Confidence Intervals
Hypothesis Testing
Normality
T Tests
1-Way ANOVA
Chi-Square
Correlation
Regression
Control Plan
Kaizen
MTBF and MTTR
Project Pitfalls
Error Proofing
Z Scores
OEE
Takt Time
Line Balancing
Yield Metrics
Sampling Methods
Data Classification
Practice Exam
... and more


