|

 content.")

The following assumptions and rules apply to use the Hypergeometric Distribution:
A random variable (x) follows this distribution if its probability mass function is given by the formula shown below:
 Hypergeometric Distribution at Six-Sigma-Material.com
Example
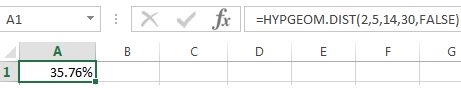
A sample of 5 parts are drawn without replacement from a total population of 30 parts. Determine the probability of getting exactly 2 defective parts. The population is known to have 14 defective parts.
Solving:
There are two outcomes and n/N = 5/30 = 16.6% which satisfies assumptions.
- n = sample size = 5
- N = population = 30
- s = "successes from sample" = 2
- S = "successes from population = 14
Substitute the values above into the probability formula above:

The probability of getting exactly 2 defective parts is 0.3576 or 35.76%
The denominator represents the total amount of combinations of selecting 5 parts from 30 parts, which is 142,506 for this example.
Keep in mind, this says "defective" parts. Each part may have one or more "defects" that cause the part to be appraised as a "defective" part. There is a difference between and defective part and a defect on a part.
Using Excel
Most statistical software programs can solve for probabilities when given the correct inputs. Entering the data correctly can be tricky so be sure to review the examples or 'help' sections within the software.
Return to other Discrete Distributions
Templates, Table, and Calculators
Subscribe to access all pages within this site
Return to Six-Sigma-Material Home Page
Recent Articles
-
Process Capability Indices
Oct 18, 21 09:32 AM
 Determing the process capability indices, Pp, Ppk, Cp, Cpk, Cpm
 -
Six Sigma Calculator, Statistics Tables, and Six Sigma Templates
Sep 14, 21 09:19 AM
 Six Sigma Calculators, Statistics Tables, and Six Sigma Templates to make your job easier as a Six Sigma Project Manager
 -
Six Sigma Templates, Statistics Tables, and Six Sigma Calculators
Aug 16, 21 01:25 PM
Six Sigma Templates, Tables, and Calculators. MTBF, MTTR, A3, EOQ, 5S, 5 WHY, DPMO, FMEA, SIPOC, RTY, DMAIC Contract, OEE, Value Stream Map, Pugh Matrix -
Six Sigma, Six Sigma Training, Courses, Calculators, Certification
Aug 15, 21 10:27 PM
 One site with the most common Six Sigma material, videos, examples, calculators, courses, and certification.

Site Membership
LEARN MORE
Six Sigma
Templates, Tables & Calculators
Six Sigma Slides
Green Belt Program (1,000+ Slides)
Basic Statistics
Cost of Quality
SPC
Control Charts
Process Mapping
Capability Studies
MSA
SIPOC
Cause & Effect Matrix
FMEA
Multivariate Analysis
Central Limit Theorem
Confidence Intervals
Hypothesis Testing
Normality
T Tests
1-Way ANOVA
Chi-Square
Correlation
Regression
Control Plan
Kaizen
MTBF and MTTR
Project Pitfalls
Error Proofing
Z Scores
OEE
Takt Time
Line Balancing
Yield Metrics
Sampling Methods
Data Classification
Practice Exam
... and more