Six Sigma Calculators, Tables & Templates
$3.99 - $4.99/ea or $14.95 for all
These templates, statistics tables, and calculators were created for project managers. Actual versions may vary from the pictures shown below. If purchasing ALL the templates & calculators, you will get directions once the purchase is confirmed by PayPal to download a .zip file that contains all the Excel files below. If ordering individual file(s), the file(s) will be emailed to the address provided in your PayPal order within 48 hours. Purchases are non-refundable. Please read our disclaimer.
Subscribers can get this bundle at a reduced price plus others that are embedded throughout this website for free. Learn more about the subscriber benefits.
TABLES will be included with purchases of ALL the templates and calculators and are available for all subscribes at no additional charge.
|
ALL Templates, Tables & Calculators $14.95 |
|
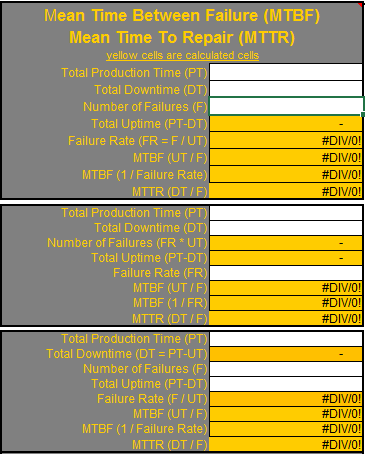
MTBF and MTTR Calculator
 |
|
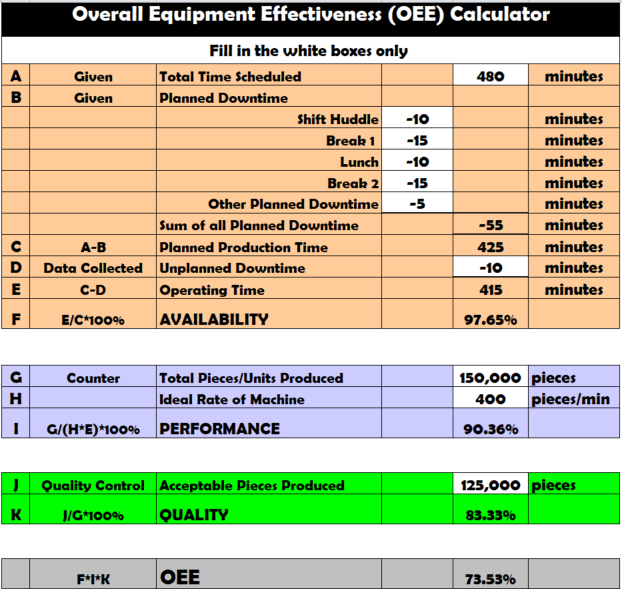
OEE Calculator
 |
|
Value Stream Mapping Symbols
|
|
|
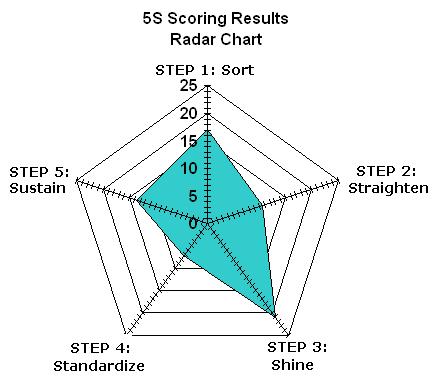
5S Scorecard & Radar Chart
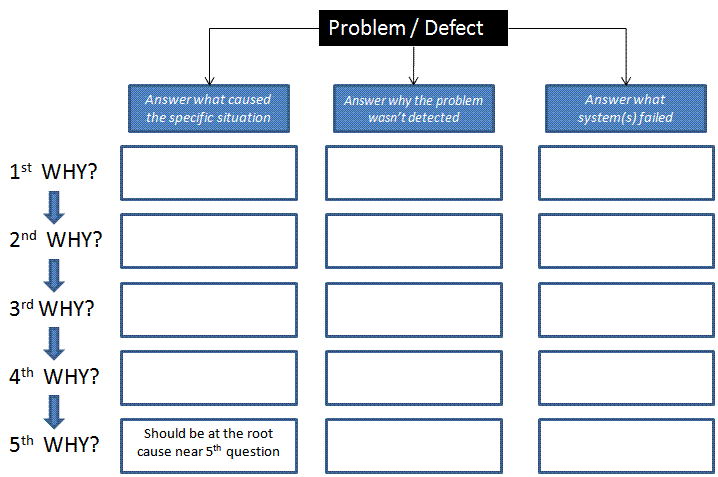
5-WHY Template
(one for Quality, Delivery, Safety, and Maintenance)
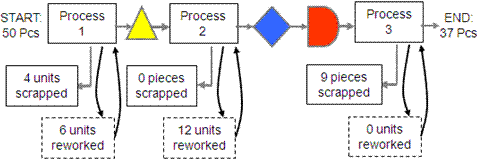
Rolled Throughput Yield Calculator
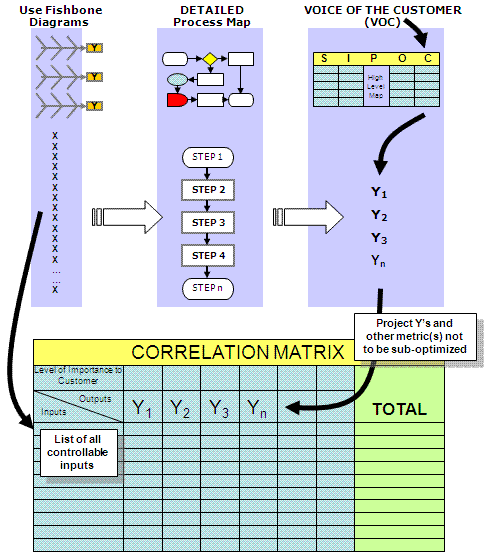
Correlation Matrix Template
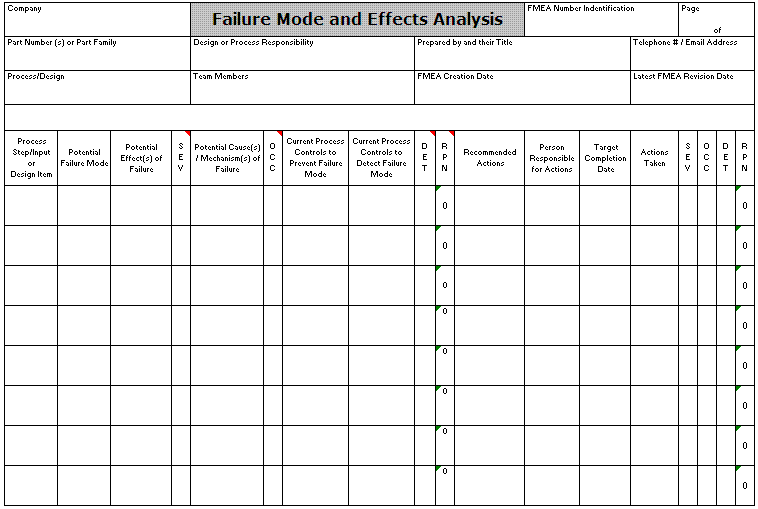
FMEA Template
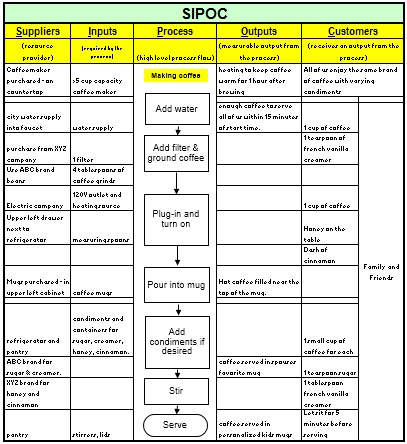
SIPOC Template
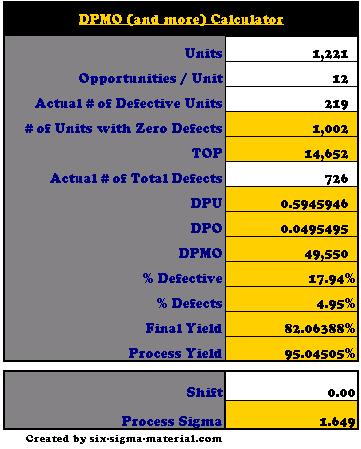
DPO / DPMO Calculator
Six Sigma Calculator
(converts to a sigma, z score)
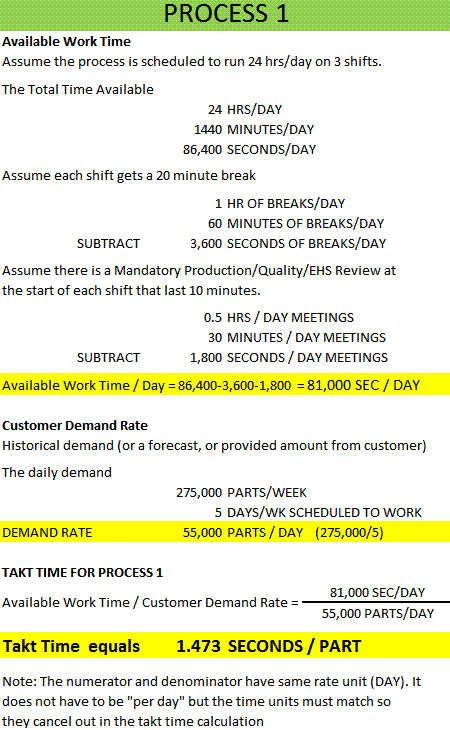
Takt Time Calculator
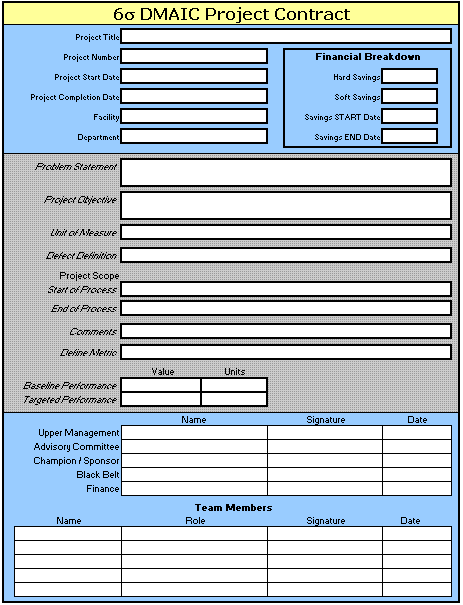
DMAIC Project Contract
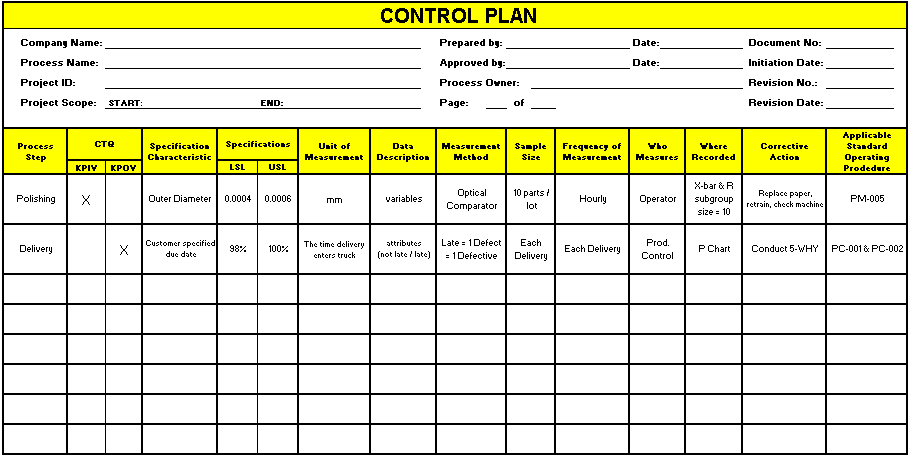
Control Plan Template
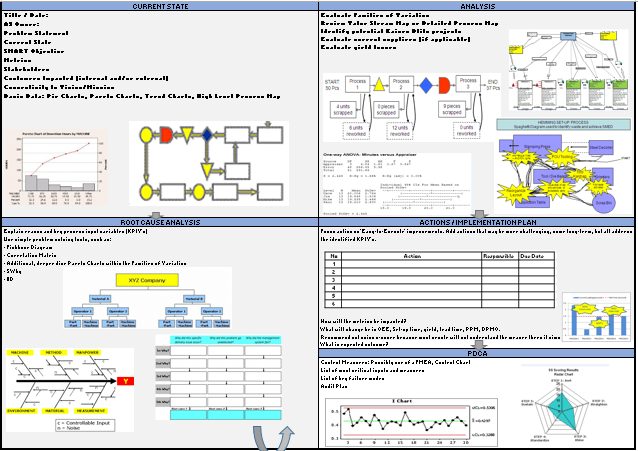
A3 Template
 |
|
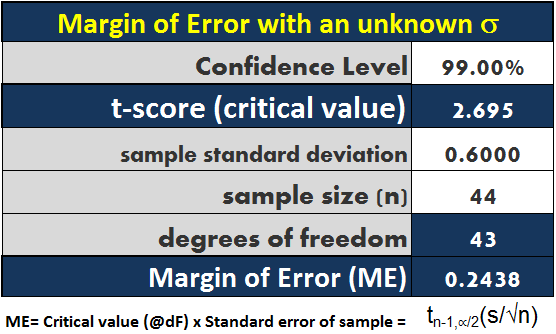
Margin of Error Calculator
for Means and Proportions
 |
|
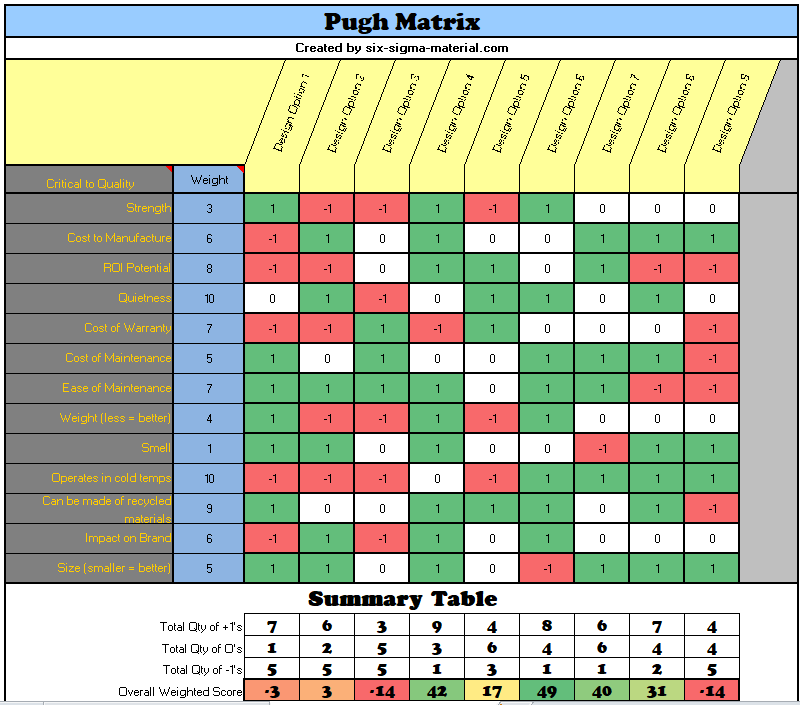
Pugh Matrix
 |
|
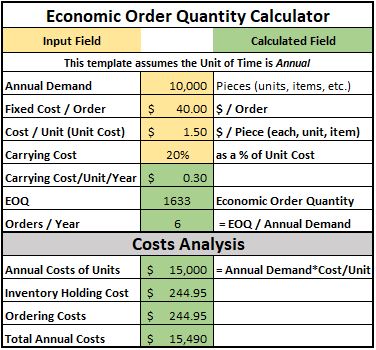
Economic Order Quantity (EOQ) Calculator
also for Economic Lot Size. Run scenarios with data readouts and an interactive graph
 |
|
|
All the above Templates, Tables & Calculators $14.95 |
|

Site Membership
LEARN MORE
Six Sigma
Templates, Tables & Calculators
Six Sigma Slides
Green Belt Program (1,000+ Slides)
Basic Statistics
Cost of Quality
SPC
Control Charts
Process Mapping
Capability Studies
MSA
SIPOC
Cause & Effect Matrix
FMEA
Multivariate Analysis
Central Limit Theorem
Confidence Intervals
Hypothesis Testing
Normality
T Tests
1-Way ANOVA
Chi-Square
Correlation
Regression
Control Plan
Kaizen
MTBF and MTTR
Project Pitfalls
Error Proofing
Z Scores
OEE
Takt Time
Line Balancing
Yield Metrics
Sampling Methods
Data Classification
Practice Exam
... and more


