|
 content.")

Predictive Maintenance
The goal of Predictive Maintenance is to reduce unplanned downtime.
But there are more direct benefits that are further down the road once a program is in place and proven over time.
Hard savings also will be found through:
Most importantly, it allows predictability in output and performance of equipment. This is the foundation to taking more advanced steps to enable Lean Manufacturing principles such as a Pull System and Just-In-Time delivery.
Your planned downtime may increase a little bit by taking the time to implement a predictive maintenance program and using the tools but will be far less expensive than the unpredictability and associated ripple effect of costs of unplanned downtime.
The following are forms of Predictive Maintenance:
Infrared Imaging
Infrared Imaging is known by several names such as Thermal Imaging and Thermography. The intent is to use differences in temperature to find significant changes that could be indicative of a looming failure.
This type of predictive tool is used in analyzing transformers, electrical panels, motor leads, bearings, to the human body for such things as breast scans and stress fractures.
There are several devices ranging in price from a few hundred dollars to six figures. While these devices seem pretty straightforward they can be best utilized once time is dedicated to training.
Proper training can help get the most out of the options that the device is capable of performing. It is also important to understand the limitations and how to properly interpret the results.
Oil Analysis
This predictive tool analyzes the condition of oil to determine whether it should be replaced. A breakdown in the performance of oil is very difficult to visually determine and that is if you can even see it.
This is an important tool to use if critical pieces of equipment depend on oil to run properly and some are more sensitive to changes in oil quality than others.
There are numerous techniques (some apply specifically for certain oils). Here are a few:
Transformers that provide power to manufacturing plants are a good example of a system that should have its oil analyzed on a regular basis to establish a baseline and examine trends.
We often think about critical machines but it is just, if not more, important to consider the utilities that keep the machines available.
Vibration Analysis
This type of analysis is used to predict shaft fatigue, bearing wear, mounting issues, sealing issues, and other items. All of these result in inefficient consumption of utilities, higher bills, unplanned downtime, noise, and potential quality issues.
Ultrasonic Leak Detection
This non-destructive predictive tool analyzes leaks in pipes and within structures themselves.
This tool is used commonly to find compressed air leaks to reduce electrical consumption. It is also used to find refrigeration, steam, boiler, hot water system leaks.
There are also Ultrasonic Gas Detectors (for safety and lower gas consumption) that use acoustic sensors to detect changes in the background noise of its environment.
Many of the sounds are not in the human detection range so it may not be sufficient to have people walk around and listen for leaks. This should find the obvious leaks but only those that are likely easiest to get too.
Destructive vs. Non Destructive Testing
Click here to learn more about Destructive and Non Destructive test methods that are likely to show up in some form on a certification exam.
Measuring Predictive Maintenance
A predictive maintenance program has costs, it requires an investment of manpower and technology. Some costs are one timers and others are ongoing such as taking regular readings, running tests, the labor associated, and software.
To ensure the investments are rewarded, it is necessary to obtain a baseline and to measure continuously.
The Predictive Maintenance devices are to obtain readings on the inputs (x's) that can lead to an output such as parts/hr, uptime, quality metrics or a combination of them that is called Overall Equipment Effectiveness.
A Six Sigma team should focus on controlling the x's and that will lead to variation reduction and drive the mean in the right direction.
Overall Equipment Effectiveness (OEE) is one recommended metric to use to measure Maintenance Programs and is now incorporated in the IATF 16949: 2016 international automotive standard.
While there are other inputs into OEE, predictive maintenance has a direct impact on all three areas of Availability, Performance and Quality.
When studying OEE it is commonly found that a root cause that affects one or all three of the components is failures that were not predicted or expected.
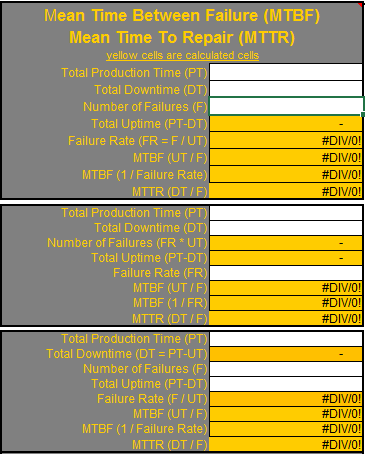
Diving deeper into OEE, two other other metrics have become commonly used to improve OEE and these are MTBF and MTTR. The two metric focus on the machines or equipment rather than material which comes into play for OEE.
Measuring the success of predictive maintenance and metrics such as MTBF and MTTR are also output indicators. Focus on measuring and controlling the deepest variables that address root causes to extend the amount of time between failures (higher MTBF) and reduce the time needed to make effective repairs (lower MTTR).
And furthermore, to understand when the next failure will happen through statistical analysis of the mean (or other measure of central tendency) and variation, you can develop a confidence interval to predict a range of time until the next failure.
From there, maintenance can be planned accordingly to the data and achieve
- the longest time span between failures
- and ensuring an unplanned failure doesn't occur.
- quickest and effective repair time
All the other metrics measured at high level will follow such as maintenance expenses budgets (MRO), overtime, scrap, and ultimately.....consistent profitability.

MTBF and MTTR Calculator
 |
|
Six Sigma templates and calculators
Search Six Sigma related job openings
Return to Six-Sigma-Material Home Page
Recent Articles
-
Process Capability Indices
Oct 18, 21 09:32 AM
 Determing the process capability indices, Pp, Ppk, Cp, Cpk, Cpm
 -
Six Sigma Calculator, Statistics Tables, and Six Sigma Templates
Sep 14, 21 09:19 AM
 Six Sigma Calculators, Statistics Tables, and Six Sigma Templates to make your job easier as a Six Sigma Project Manager
 -
Six Sigma Templates, Statistics Tables, and Six Sigma Calculators
Aug 16, 21 01:25 PM
Six Sigma Templates, Tables, and Calculators. MTBF, MTTR, A3, EOQ, 5S, 5 WHY, DPMO, FMEA, SIPOC, RTY, DMAIC Contract, OEE, Value Stream Map, Pugh Matrix -
Six Sigma, Six Sigma Training, Courses, Calculators, Certification
Aug 15, 21 10:27 PM
 One site with the most common Six Sigma material, videos, examples, calculators, courses, and certification.

Site Membership
LEARN MORE
Six Sigma
Templates, Tables & Calculators
Six Sigma Slides
Green Belt Program (1,000+ Slides)
Basic Statistics
Cost of Quality
SPC
Process Mapping
Capability Studies
MSA
SIPOC
Cause & Effect Matrix
FMEA
Multivariate Analysis
Central Limit Theorem
Confidence Intervals
Hypothesis Testing
T Tests
1-Way ANOVA
Chi-Square
Correlation
Regression
Control Plan
Kaizen
MTBF and MTTR
Project Pitfalls
Error Proofing
Z Scores
OEE
Takt Time
Line Balancing
Yield Metrics
Sampling Methods
Data Classification
Practice Exam
... and more
Statistics in Excel

Need a Gantt Chart?