|

 content.")
Kurtosis
Shape of the Distribution
There are three types of kurtosis which is a description of the "peakedness" or "flatness" of the probability distribution curve relative to the bell curve of a normal distribution. This does not have to do with skewness.
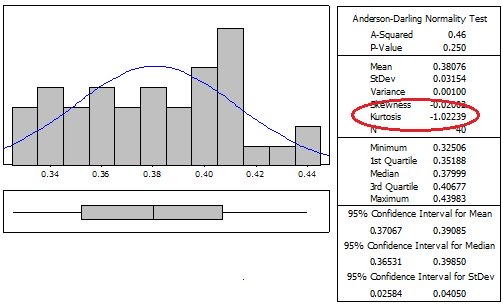
1) Platykurtic - negative kurtosis value indicating a flatter distribution that normal bell curve. The lower the value the flatter the distribution with more spread. An example is the Uniform Distribution which has a kurtosis = -1.2.
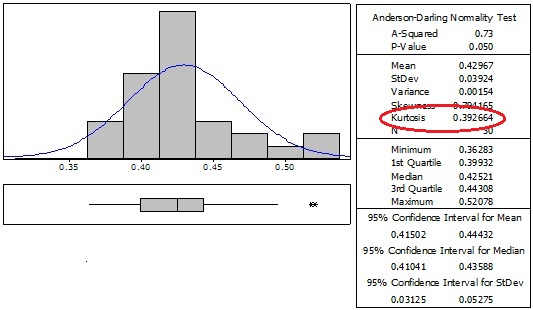
2) Leptokurtic - positive kurtosis value indicating a peaked shaped distribution compared to normal bell curve. The higher the value the sharper the peak the distribution and less spread. An example is the Double Exponential Distribution which has a kurtosis = 3.
3) Mesokurtic - when kurtosis value = 0. A normal distribution has a kurtosis value of zero. It is in between the first two types.
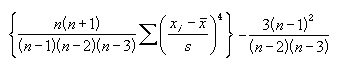
Calculating the Kurtosis value
The formula for calculating kurtosis is shown below with an example. The sample size must be a least four.
s = sample standard deviation
n = number of samples
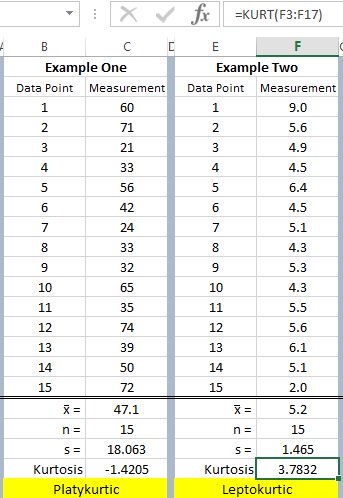
Examples
There are two sets of data shown with 15 samples each. The calculations are shown with the kurtosis value for each set. The formula in Excel is shown in the upper right.
Other examples
Platykurtic
Leptokurtic
Recent Articles
-
Process Capability Indices
Oct 18, 21 09:32 AM
 Determing the process capability indices, Pp, Ppk, Cp, Cpk, Cpm
 -
Six Sigma Calculator, Statistics Tables, and Six Sigma Templates
Sep 14, 21 09:19 AM
 Six Sigma Calculators, Statistics Tables, and Six Sigma Templates to make your job easier as a Six Sigma Project Manager
 -
Six Sigma Templates, Statistics Tables, and Six Sigma Calculators
Aug 16, 21 01:25 PM
Six Sigma Templates, Tables, and Calculators. MTBF, MTTR, A3, EOQ, 5S, 5 WHY, DPMO, FMEA, SIPOC, RTY, DMAIC Contract, OEE, Value Stream Map, Pugh Matrix -
Six Sigma, Six Sigma Training, Courses, Calculators, Certification
Aug 15, 21 10:27 PM
 One site with the most common Six Sigma material, videos, examples, calculators, courses, and certification.

Site Membership
LEARN MORE
Six Sigma
Templates, Tables & Calculators
Six Sigma Slides
Green Belt Program (1,000+ Slides)
Basic Statistics
Cost of Quality
SPC
Control Charts
Process Mapping
Capability Studies
MSA
SIPOC
Cause & Effect Matrix
FMEA
Multivariate Analysis
Central Limit Theorem
Confidence Intervals
Hypothesis Testing
Normality
T Tests
1-Way ANOVA
Chi-Square
Correlation
Regression
Control Plan
Kaizen
MTBF and MTTR
Project Pitfalls
Error Proofing
Z Scores
OEE
Takt Time
Line Balancing
Yield Metrics
Sampling Methods
Data Classification
Practice Exam
... and more