Population & Samples
Gathering and analyzing samples instead of the entire population is often the most practical and cost effective way to make inferences about an entire population.
Samples are collected instead of population since collecting data on an entire population is most often impossible, saves money, and time, and may reduce destruction of a product if that is what is necessary to get data (such tensile testing).

There are various techniques for gathering samples and these should be understood by a Six Sigma project manager.
When there is an attempt to measure across the entire population, then this is referred to as census. But this can be costly, destructive, and time consuming.
There are several methods of sampling. It is important to choose the best plan to provide the best output of information about the entire population. A few common methods are listed below and explained further down the page.
Often when sample sizes are large enough, the Central Limit Theorem applies opening up the use a several simple parametric hypothesis tests for statistical analysis in the ANALYZE phase.
The size of the sample must be decided on by the Six Sigma Project Manager based on the allowable alpha and beta-risks (statistical significance) and the magnitude of shift that you need to observe for a change of practical significance.
As the sample size increases, the estimate of the true population parameter gets stronger and can more reliably detect smaller differences. This seems logical, the closer you get to analyzing all the population, the more accurate your inferences should be about that population.
It's important for the GB/BB to get the proper amount and representation of samples to understand the power of the test, ensure the assumptions are met, analyze normality, but yet minimize resources and destruction of parts.
Inspection and auditing sample plans are typically chosen by their:
- Known Risks
- Validity
- Applicability
1) Random (probability) Sampling Methods
If you were trying to evaluate the average length of every rainbow trout in the freshwater lakes of Minnesota, it would not be practical or affordable. A sampling plan would be devised to gather a some of the trout and study them. From this, references to the population with specified levels of confidence can be done.
2) Nonrandom (nonprobability) Sampling
Nonrandom techniques are not preferred due to the additional risk of sampling error introduced. The error can not be calculated and these results are not preferred to infer about the population from with the sample was selected. Therefore, we will not discuss them further within this website.
Samples - Short and Long Term


"N" and "n-1"
The denominator in the standard deviation for a population is N, the denominator for a sample is n-1. The "n-1" is an unbiasing factor and as the sample size approaches infinity, the value of "n-1" approaches "N".
Understand the results of the statistical program or calculator being used.
The difference between long term and short term samples
Statistical Notations
 Six-Sigma-Material.com
Descriptive measures that describe a POPULATION are called PARAMETERS and are usually denoted with Greek letters. A population parameter is the true value of a population attribute.
Descriptive measures that describe a SAMPLE are called STATISTICS. A sample statistic is an estimate (based on the sampled data) of a population. Therefore, the sampling method is critical to infer the most accurate information about a population.
The quality of a sample statistic is strongly affected by how the data is gathered and how well it represents (accuracy and precision) the population.
Random Sampling Methods
The word 'random' means that theoretically requires that every item (part) has the same chance of being chosen (i.e. each item in a lot has an equal chance of being selected).
Sampling plans for inspections and auditing are typically selected as a function of their known risks, validity, and applicability.
Listed below are a few sampling methods. Not mentioned is "discovery sampling" which is most often used in auditing.
Simple Random Sampling
Select this plan if every sample in the population has an equal chance of being selected and there are no subgroups known within the population. The picture below assumes a samples (x’s) are equal and that selecting any of them (a sampling) from the entire population will represent and behave similar to the rest of the population.
- the population consists of "N" items.
- a sample consists of "n" items.
- and all possible samples have equal chance of being selected.
- the most elementary random sampling technique.
One example of this method is picking names out of a hat. If all the names are in a hat on the exact same medium (none are heavier, bigger, etc.) and each name is entered the same amount of times then each name has the same chance of being selected. This is analogous to the lottery approach.
Random number generators and tables can be used to select samples but there are other methods.

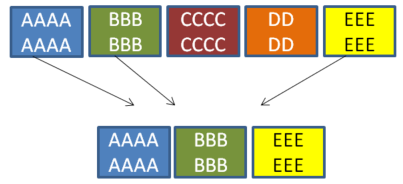
Stratified Sampling
Dividing the population into subgroups of interest and sampling either sequentially or randomly within each subgroup. This is important to make sure there is representation from all stratifications in the population.
Stratified sampling is recommended if a population (such as a mixture) is thought to be non-homogeneous or has possible separation.
A subgroup may be data taken at certain temperature range, specific shift, under certain pressure, different machine groups, slower speed versus higher speed, and other different conditions.

Sequential Sampling
Acquiring data at specified intervals such as every hour, every 5th form, or on a particular shift. Ensure the interval does not introduce a pattern that may be biased to a specific person, machine, or part each time the data point is collected.
Sequential sampling and Discovery sampling are commonly used in auditing.

Cluster Sampling
This type of sampling is done when the population is divided into clusters or groups. For there specific clusters are randomly selected for sampling. A 'cluster' may be region, height range, age range, gender, affiliation, machine type, form type, operator skill level, etc.
SUMMARY:
An appropriate and disciplined plan needs to be clearly understood by those collecting the data. Since the collection process can be expensive and time consuming there may be bias introduced by people making educated guesses, predictions of data, and collecting data that is convenient and simple.
There are also guidelines for the quantity of samples needed for various types of data. The more data you can obtain the more likely it will represent the performance of the entire population (long-term performance of the process).
When describing and presenting the data, inform the audience and record the method used to collect the data on the Data Collection Plan.
Type of bias found in sampling
A goal of the Six Sigma project manager is to recognize potential bias in the data (or responses) and prevent it from coming into play if possible. Forms of bias that can be introduced into the sampling strategy are:
- Convenience bias: Often found when time or money is serious constraint and sampling only done when it is convenient.
- Non response bias: When a response is needed according to the sampling strategy but the response is incomplete or not provided at all.
- Response bias: Occurs when response is misleading, inaccurate or untruthful. occurs when the responder feels pressure that occurs during data collection and influences the response (i.e. social pressure to be accepted and avoid conflict).
- Voluntary Response bias: when sample members are self-selected volunteers or when the responders (often people) can choose whether to participate. The resulting sample tends to overrepresent individuals who have strong opinions.
.
Sampling Error
Sampling Error is when the sample is not representative of the population. This is why it is important to develop an effective and practical sampling strategy.
Therefore, the sample statistics (calculated) can be used as an accurate estimate of the population parameter.
Nonsampling Error
Nonsampling errors includes those such as:
- Recording or documenting errors
- Data input errors
- Data analysis errors
- Measurement device error
- Unclear instructions or definitions
Learn how to calculate Sample Size
Templates, Tables, and Calculators
Return to the Six-Sigma-Material Home Page
Recent Articles
-
Process Capability Indices
Oct 18, 21 09:32 AM
 Determing the process capability indices, Pp, Ppk, Cp, Cpk, Cpm
 -
Six Sigma Calculator, Statistics Tables, and Six Sigma Templates
Sep 14, 21 09:19 AM
 Six Sigma Calculators, Statistics Tables, and Six Sigma Templates to make your job easier as a Six Sigma Project Manager
 -
Six Sigma Templates, Statistics Tables, and Six Sigma Calculators
Aug 16, 21 01:25 PM
Six Sigma Templates, Tables, and Calculators. MTBF, MTTR, A3, EOQ, 5S, 5 WHY, DPMO, FMEA, SIPOC, RTY, DMAIC Contract, OEE, Value Stream Map, Pugh Matrix
Site Membership
Click for a Password
to access entire site
Six Sigma
Templates & Calculators

Six Sigma Modules
The following are available
Click Here
Green Belt Program (1,000+ Slides)
Basic Statistics
Cost of Quality
SPC
Process Mapping
Capability Studies
MSA
Cause & Effect Matrix
FMEA
Multivariate Analysis
Central Limit Theorem
Confidence Intervals
Hypothesis Testing
T Tests
1-Way ANOVA
Chi-Square
Correlation and Regression
Control Plan
Kaizen
MTBF and MTTR
Project Pitfalls
Error Proofing
Effective Meetings
OEE
Takt Time
Line Balancing
Practice Exam
... and more