F Distribution
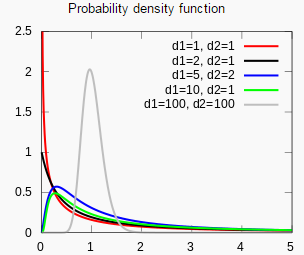
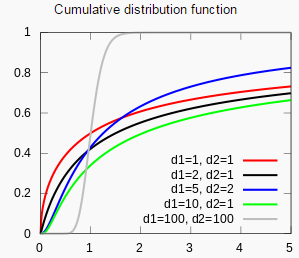
The F distribution is a continuous probability distribution and is used within the analysis of variance (ANOVA) that uses the F-test in which the actual calculated value is compared to the F-test statistic for hypothesis testing.

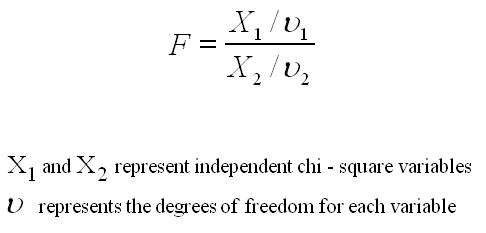
This distribution is the probability of the ratio of two independent chi-square variables, with each divided by it's own degrees of freedom.
Often used in ANOVA, which test whether population means are equal.
It is used in both 1-Way ANOVA and 2-Way ANOVA.
Rarely is the probability density function calculated mathematically. Thankfully that work has been done and F-tables with the most common levels of significance and degrees of freedom exist for reference.

BE CAREFUL when using tables. Some tables are for one-tailed test and others cover two-tailed test.
For a one-tailed test, the null hypothesis is rejected when the test statistic is greater than the value given in the F-table value.

Search Six Sigma related job openings
Site Membership
Click for a Password
to access entire site
Six Sigma
Templates & Calculators
Six Sigma Modules
The following are available
Click Here
Green Belt Program (1,000+ Slides)
Basic Statistics
Cost of Quality
SPC
Process Mapping
Capability Studies
MSA
Cause & Effect Matrix
FMEA
Multivariate Analysis
Central Limit Theorem
Confidence Intervals
Hypothesis Testing
T Tests
1-Way ANOVA
Chi-Square
Correlation and Regression
Control Plan
Kaizen
MTBF and MTTR
Project Pitfalls
Error Proofing
Effective Meetings
OEE
Takt Time
Line Balancing
Practice Exam
... and more


