CONTROL
The final phase of a DMAIC Project!

The CONTROL phase is the conclusion of the team's journey. The GB/BB is responsible for a solid hand-off to the Process Owner to maintain the gains.
The final capability is determined and the closing performance and all related changes are documented on the closing contract. This phase is not as statistically intensive as the MEASURE, ANALYZE, and IMPROVE phases.
Rewarding the team and stakeholders is important because they not only deserve it but to leave on a final positive note and grow credibility for the GB/BB and the company's Six Sigma program.
There can not be enough emphasis placed on the importance of devoting the same high level of energy and commitment throughout this phase. Complacency and anxiety can set in for the sake of bringing closure receiving credit for executing a project.
This can result in the process reverting to the former performance levels and loss of some or all of the gains. In addition, the Six Sigma program and the GB/BB lose credibility.
One of the most common complaints of a Six Sigma program is that is a "flavor of the month" or "common sense stuff". Rigorous follow-up and corrective action with comprehensive documentation can increase the likelihood that the gains are sustained.
The number one killer for your reputation as a GB/BB and the overall company's program is when a process reverts back to the original performance...do not allow that to happen.
The GB/BB should also make recommendations to upper management or a MBB for future project recommendations to further improve process performance. These can lead to new Six Sigma projects or Kaizen Events. Present some interesting findings and improvements that stemmed from the findings.
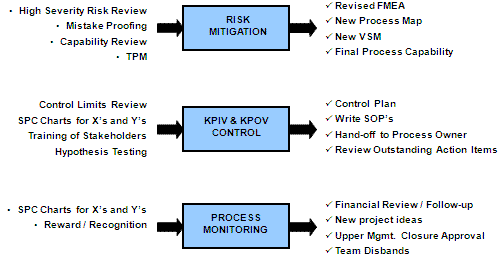
Below are a list of tools commonly used in this phase.
SPC Charts
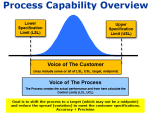
Assessing Final Process Capability
Process Yield Metrics
FY - Final Yield
TPY - Throughput Yield
RTY - Rolled Throughput Yield
NY - Normalized Yield
Other Tools
Revised FMEA
Mistake Proofing
Control Plan
Testing Methods (Destructive and Nondestructive)
Verify Financial Savings
and finally.....close out the Project Contract!
Recalculating Control Limits
Once the improvements are complete it
may be warranted to calculate new process control limits and make these
limits the triggers for corrective and preventive action.
If the
three questions below can be answered YES then recalculate the control
limits of the process and use them on the SPC charts and document them
on the Control Plan for future monitoring.
- Is the data statistically different from BEFORE and AFTER?
- Are the reasons for the change understood and favorable?
- Is the AFTER behavior expected to represent future performance in the long term?
If
you can not answer YES to all of the above criteria then the Process
Owner should have information in the Control Plan that identifies corrective
action and ideas for the special causes (assignable causes). The
process is probably not mature, or in enough control, to use recalculated
control limits.
Process control should be done before assessing final process capability.
|
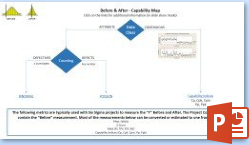
Before and After Capability Roadmap This download is available to members |
Templates, Tables, and Calculators
Six Sigma Certification programs
Subscribe to access entire site
Search Six Sigma related job postings
Return to the Six-Sigma-Material Home Page

Site Membership
LEARN MORE
Six Sigma
Templates, Tables & Calculators
Six Sigma Slides
Green Belt Program (1,000+ Slides)
Basic Statistics
Cost of Quality
SPC
Process Mapping
Capability Studies
MSA
SIPOC
Cause & Effect Matrix
FMEA
Multivariate Analysis
Central Limit Theorem
Confidence Intervals
Hypothesis Testing
T Tests
1-Way ANOVA
Chi-Square
Correlation
Regression
Control Plan
Kaizen
MTBF and MTTR
Project Pitfalls
Error Proofing
Z Scores
OEE
Takt Time
Line Balancing
Yield Metrics
Sampling Methods
Data Classification
Practice Exam
... and more
Statistics in Excel
Need a Gantt Chart?
