Normalized Yield (NY)
Normalized Yield (NY) is the average yield per process step. It's the probability of a unit passing through one process step or opportunity without rework. It's the minimum Throughput Yield (TPY) for each step of the process to achieve a given Rolled Throughput Yield (RTY).
NY is used when the TPY is not known for each step of a process but the RTY for the entire process is known. Recall, if the TDU is known, the RTY can be found and then the NY can be determined, click here to review.
Then the NY is used to assume each step of the process has the same average yield.
CAUTION: Applying that logic can be misleading since true yields at each step can be significantly different. This is sometimes referred to as the "typical" yield. These yield metrics can be inaccurate with skewed distributions or heavy tailed distributions...in other words distributions that are not normal.
Formula:
where k equals the number of processes.
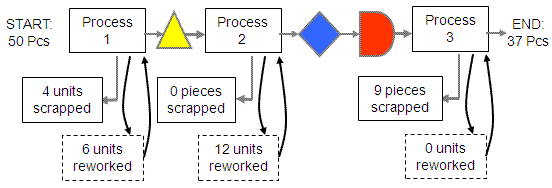
A calculation using example from above:
Calculation:
Using k = 3
NY = 0.476^(1/3)
NY = 0.781 = 78.1%
There is a 78% chance of a unit passing through one process step without rework.
Another relationship is shown below to obtain the normalized defects per unit.
The normalized defects per unit equals -ln(0.781) = 0.24718.
Normalized Yield and other yield metrics can serve as baseline scores (Measure Phase) and final scores for Six Sigma projects (Control Phase).
The baseline score does not have to be a z-score and often these yield metrics are easier for team and other company employees to relate with and understand.
Converting to Z-benchmark score
Zbenchmark = ZNY + 1.5 (assumed shift to short-term or "best-case" performance)
The z-value of 0.24718 using an approximation from a standard normal curve z table = 0.686.
Therefore,
Zbenchmark = 0.686 + 1.5 = 2.186
Other Process Yield Metrics
Return to BASELINE MEASUREMENTS
Return to the MEASURE phase
Search active Six Sigma related job openings
Return to the Six-Sigma-Material home page
Site Membership
Click for a Password
to access entire site
Six Sigma
Templates & Calculators
Six Sigma Modules
The following are available
Click Here
Green Belt Program (1,000+ Slides)
Basic Statistics
Cost of Quality
SPC
Process Mapping
Capability Studies
MSA
Cause & Effect Matrix
FMEA
Multivariate Analysis
Central Limit Theorem
Confidence Intervals
Hypothesis Testing
T Tests
1-Way ANOVA
Chi-Square
Correlation and Regression
Control Plan
Kaizen
MTBF and MTTR
Project Pitfalls
Error Proofing
Effective Meetings
OEE
Takt Time
Line Balancing
Practice Exam
... and more


