Capability Index, Pp
Pp is a process index that numerically describes the long term capability (Cp is short term indicator) of a process assuming it was analyzed and stays in control.
It is an option (along with z-score and PPM) when describing process baseline measurement in the MEASURE phase or in the CONTROL phase when obtaining the final performance analysis.
As with all the process capability indices, the process must be in control before assessing capability. Use time-series and control charts to determine process control. If the process is out of control (i.e. still rising with upward trend), then assessing current process performance is not likely to reflect the long term performance.
Both Pp and Cp relate the variation of the distribution to the allowable tolerance specifications.
Similar to Cp, this capability index is only a function of the standard deviation, not a nominal (target) value that may be historical or provided by the customer.
It also requires input from the customer for the lower specification limit (LSL) and upper specification limit (USL).

where the estimation for sigma is (also sometimes called the overall, long-term, or cumulative data sigma (and also for Ppk)

Acceptability
Values >1.00 and >1.33 are common acceptability levels for Pp.
Note:
The Pp index accounts for all the short term sample variances (Cp) and typically will be lower over the long term. The standard -1.5 sigma shift from short term to long term doesn't exactly apply but there is a commonly accepted reduction of acceptability from Cp to Pp.
Click the link to examine the difference between short term and long term samples.
DETERMINING ACCEPTABILITY LEVEL
Customers vary in their minimum requirement for the values of capability indices. As the pursuit for perfection increases these minimum acceptability levels will increase. In this case it means that process must perform with less and less variation.
The acceptability level may be available in the form of published standards or it may need to be requested specifically. The amount of samples required for capability analysis and control charts can also vary by customer and needs to be determined before starting these items.
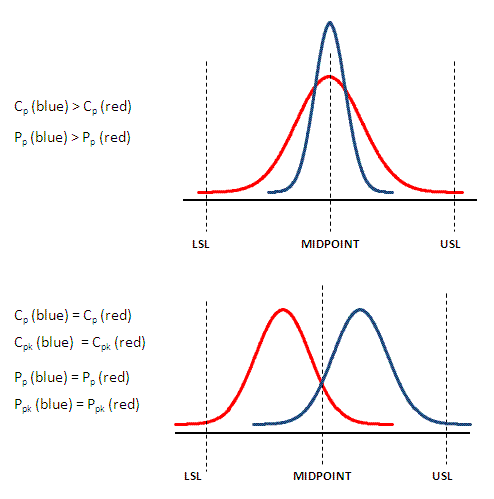
Visual Relationship of Capability Indices
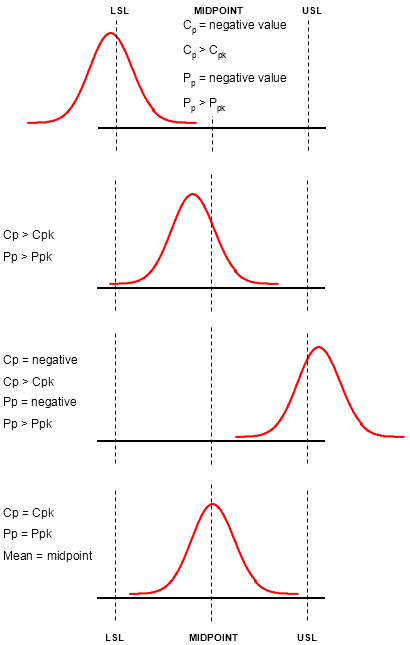
Additional Visual Aids
General rule of thumb

Other Capability Indices
Site Membership
Click for a Password
to access entire site
Six Sigma
Templates & Calculators
Six Sigma Modules
The following are available
Click Here
Green Belt Program (1,000+ Slides)
Basic Statistics
Cost of Quality
SPC
Process Mapping
Capability Studies
MSA
Cause & Effect Matrix
FMEA
Multivariate Analysis
Central Limit Theorem
Confidence Intervals
Hypothesis Testing
T Tests
1-Way ANOVA
Chi-Square
Correlation and Regression
Control Plan
Kaizen
MTBF and MTTR
Project Pitfalls
Error Proofing
Effective Meetings
OEE
Takt Time
Line Balancing
Practice Exam
... and more


