|

 content.")
Proportions Tests
This module covers hypothesis testing of Proportions involving one factor and with one, two, or more samples. These tests assume a Binomial Distribution.
Assumptions:
- Random samples from each of the population groups
- Data type is nominal (categorical)

The following two test will be covered below and chi-square is within another module.
- 1 Proportion Test: Analyze difference in a sample proportion and target
- 2 Proportion Test: Analyze difference in two sample, independent, proportions
- Chi-square Test: Click here
Applications
1 Proportion Test Examples
Determine if there is a difference in the percentage of voters that turn out for an election compared to a target (or claim)
Determine if a percentage success rate claim is actually as claimed
Determine if proportion of vegetarians has grown compared to the proportion from two years ago. Furthermore, could evaluate this by female or male
2 Proportion Test Examples
Determine if there is a difference in the percentage of voters that turn out for two elections
Determine if there is a difference in the defect rates between two operators (or two machines, or two shifts)
Determine if there is a difference in percentage of delivery performance among two suppliers
Compare proportion of females and males that are vegetarians
Chi Square Test Example
Determine if there is a difference in percentage of delivery performance among six suppliers
Follow the process below for hypothesis testing to help break down the problem to simpler steps.

1 Proportion Test
1 Proportion Test - Example One
A Six Sigma Black Belt gathers data that shows 27,798 out of 112,561 registered voters voted in the last election. One party believes that if there is a lower overall turnout they will have a better chance to win the next election.
The goal for that party is to have fewer than 25% of registered voters to vote in the next election. Test the hypothesis that at least 25% of the people turned out for the last election.
1) Practical Problem:
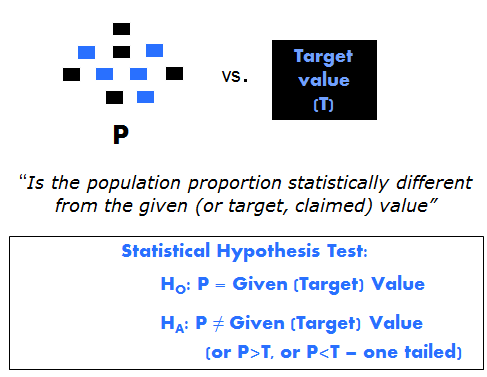
Is the proportion from the population different from the target value? The target value may be an actual target, a historical value, or some other given value.
Is the percentage of voters from the last election <25%?
2) Statistical Problem:
Ho: P = Target (or given) value
HA: P ≠ Target value (two-tailed), P < Target value (one-tail) or P > Target value (one-tail)
Assume the α-risk is 0.05. Reject the null hypothesis if p-value < α-risk. Calculate the p-value applying the Binomial Distribution.
A registered voter did one of two things: Voted or Did Not Vote (binomial).
Is population proportion of voters <25%?
- Ho: P = 25%
- HA: P < 25% (one-tailed test)
3) Statistical Solution:
Using Minitab to determine the exact p-value. When entering the data in Minitab for this example the "events" are sometimes referred to as the "successes" although that may not be the correct term to apply to each problem. The term "trials" is the denominator of the percentage (or the population of registered voters in this case).


The p-value is 0.009. Since the p-value < α-risk of 0.05, reject the null hypothesis.
Recall, the p-value represents the probability of being wrong if the null hypothesis is rejected.
4) Practical Solution:
Infer HA: There is sufficient evidence that less than 25% of the registered voters will vote.
This is the conclusion that the party desires; however, if 27,901 people voted that is the critical value were the p-value = α-risk of 0.05. That represents a difference of only 103 people and the statistical conclusion reverses.
Reminder, before reaching any statistical conclusion verify the assumptions are satisfied.
Sample size matters
The sample size is the total number of observations in the sample and it affects the confidence interval and the power of the test.
Usually, a larger sample size results in a narrower confidence interval. A larger sample size also gives the test more power to detect a difference. For more information, go to What is power?.
The proportion (or percentage) of voters in the above example is 24.696%. Let's assume the same approximate percentage but from a smaller population of registered voters. Say that 409 out of 1,656 registered voters voted (which is 24.698%) and run the same test.
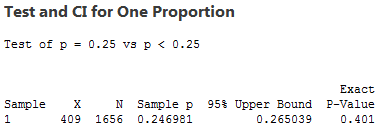
The results is a p-value of 0.401.
The result is the opposite from above. The p-value is > 0.05, infer the null hypothesis, HO.
There is insufficient evidence that <25% of registered voters will vote. Practically speaking, the party should be concerned if there is a similar turnout for the next election and the population is this small (1,656 registered people).
In this case, it is the sample size that is impacting the hypothesis test. In the earlier example there was not enough of a sample size to bring enough strength to the conclusion.
There is strength in numbers and logically, the more samples, the more representative of the population, the more confident the result.
Click here to learn more about sample size.
1 Proportion Test - Example Two
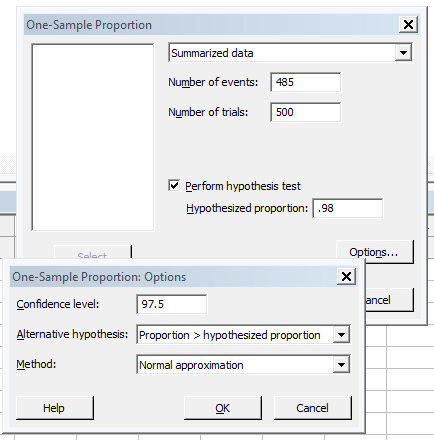
A large supplier of components is advertising that at least 98% percent of their customers are pleased with the quality of their components. With >500,000 customers and growing skepticism, a research firms decides to conduct their own analysis. The research firm is careful to use simple random sampling which allows the use of this statistical test.
They sampled 500 customers and 485 of them agreed that they are pleased.
Assuming a 0.025 level of significance and these figures from the sample what conclusions can be drawn?
State the Practical Problem:
Is the claim that >98% of their customers are pleased an accurate statement?
Write the Practical Problem:
Null Hypothesis, HO: P = 0.98
Alternative Hypothesis, HA: P > 0.98
Keep in mind the Null and Alternative must be mutually exclusive, which means they cannot overlap.
This is a one-tailed test since the words "at least" were used instead of saying just 98% (which would leave the test open both ways becoming two-tailed). The words "at least" also means "greater than or equal to".
Alpha risk = Level of Significance = 0.025 (or 2.5%)
485 of 500 customer in the sampled were found to be pleased, equaling 97%. Based on the sample size the initial conclusion may be that the supplier's claim is not true since 97% is <98%.
However, the sample proportion may be too small to statistically conclude that the suppliers claim is valid.
For alpha risk of 0.025, we shall reject the Null Hypothesis if p lies more than 1.96 standard deviations above P = 0.98.
Find the Statistical Solution:
P represents the hypothesized population proportion
p represents the sample proportion that are pleased.
P = 0.98
1 - P = 0.02
p = 0.97
Calculate the standard deviation and z-score test statistic to lead to a p-value.
Sample standard deviation = sqrt(P * (1-P) / n) = sqrt(0.98 *0.02 / 500) = 0.00626
z = (p - P) / st. dev = (0.97 - 0.98) / 0.00626 = -1.597 or -1.60
Since this is a one-tailed test, the p-value represents the probability that the z-score is greater than -1.60.
P(z > -1.60) = 0.9452 using the table shown below.
State the Practical Conclusion:
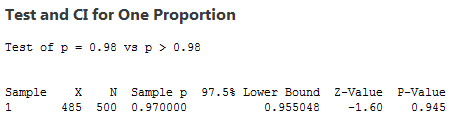
The approximate p-value using normal distribution table is 0.9452 and the exact p-value is 0.953. Both are close to the same which is > than the α-risk of 0.025.
Therefore, infer the Null Hypothesis, HO. There is insufficient evidence to support the claim that >98% of the customers are pleased.

Using Minitab
Using the Normal Approximation option (under Method) shows the z-value and show the approximate p-value. The exact p-value is 0.953 which has the same practical conclusion as the approximate p-value of 0.945.
2 Proportion Test

2 Proportion Test - Example One
State the Practical Problem:
Is there a difference between the two population proportions (p1 - p2) using the data gathered from two independent samples.
The difference is the unknown difference between the population proportions that you want to estimate.
Write the Practical Problem:
- HO: P1 = P2 (sometimes written as P1 - P2 = 0 which is the same)
- HA: P1 ≠ P2
The level of significance, α-risk, chosen is 0.05.
Find the Statistical Solution:
In this case we will use Minitab for simplicity.
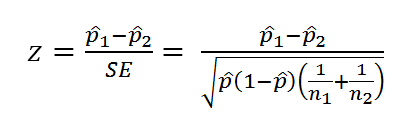
For your information, the formula to calculate the z-score test statistic is shown below when testing for no difference. The standard error represents the denominator of the formula.
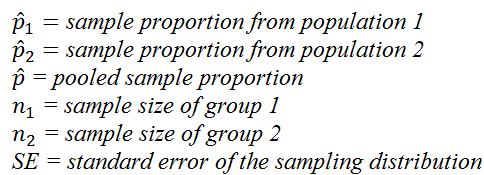
Using Minitab
In this case, the data is provided as summarized. However, you may have it in columns within Minitab or all in one column.
The Number of Events is sometimes referred to as "successes" but that isn't always the most appropriate word depending on your situation.
The Trials value is the total number of samples for each proportion being studied.
Select Options to bring up a dialog box to fill in the remaining selections and click 'OK' a couple times to run the test. The following results appear:

The p-value < α-risk of 0.05. Therefore, reject the HO (null hypothesis) and infer the HA.
State the Practical Conclusion:
There is a difference between the proportion of vegetarians less than 30 years of age compared to the proportion greater than 30 years of age.
That result is somewhat obvious due to quick glance at the numbers and the fact that the sample sizes are large. This result alone isn't very meaningful. You may want to continue running scenarios to understand how much different the proportions are that can be statistically supported.
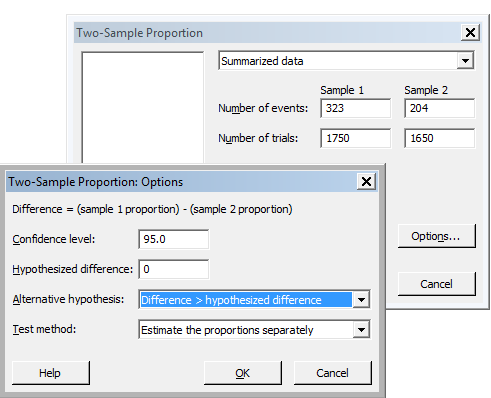
Let's test a new claim for further review on this topic:
Let's say the Alternate Hypothesis was that the to prove the proportion of vegetarians under the age of 30 was greater than the proportion of vegetarians over the age of 30.
HA: P1 > P2
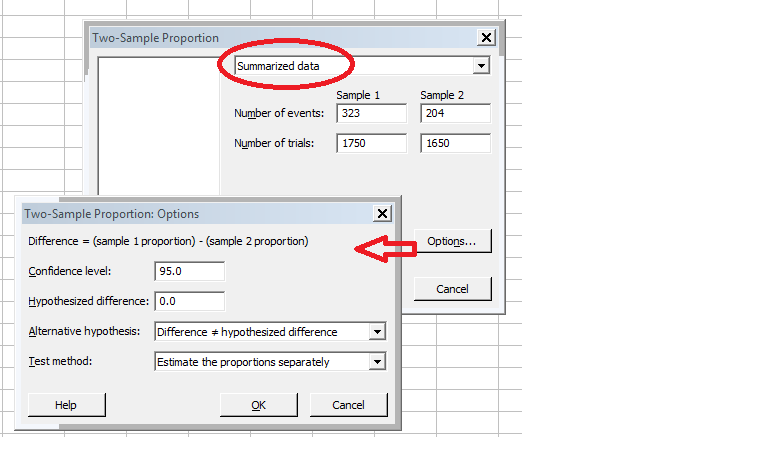
The selection is shown below in Minitab:
The final results are a p-value = 0.000 which is the same practical conclusion as above, which is not a complete surprise either based on quick review of the proportions themselves.
Let's try yet another claim.
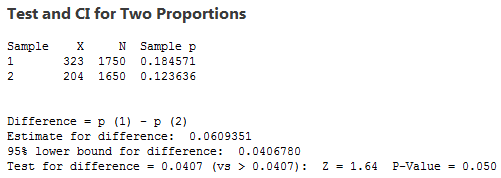
There is a claim that the proportion of women that are vegetarians under the age of 30 is >6% than the proportion of women over the age of 30. Using the same samples and risk, the Minitab entries are shown as below:
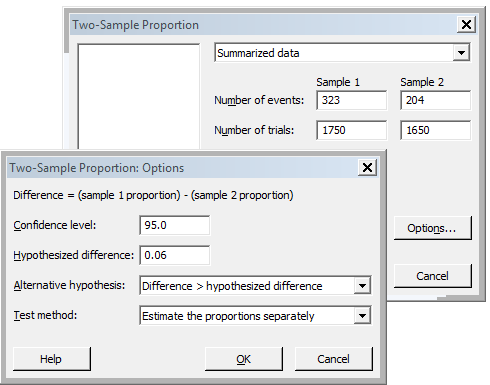

The p-value when testing whether the difference is >6% = 0.470, so in this case there is not enough evidence to reject the Null Hypothesis, HO.
Therefore, there is not enough evidence to support a claim that the proportion of women under the age of 30 that are vegetarians is >6% than the proportion of women that are vegetarians over the age of 30.
So, what is the critical value, given these same samples and risk?
See the findings below. The percentage of 4.07% is the critical value where the p-value = level of significance or the alpha risk (α-risk).
Confidence Interval
An approximation for the Confidence Interval for a population proportion is shown below. Many business decisions involve population proportions such as estimating market share and proportions of goods that are acceptable or defective.
EXAMPLE:
A survey was conducted on 300 emerging, domestic, small capital companies and found that 153 had an Emergency Action Plan that detailed reaction plans to maintain operations and customer service in the event of major illness or outbreak such as the swine flu.
Calculate the 92% confidence interval to estimate the proportion of emerging domestic, small capital companies that have an adequate Emergency Action Plan.
n = 300
p-hat = 153/300 = 51% = 0.51
The critical Z(0.04) value = 1.75
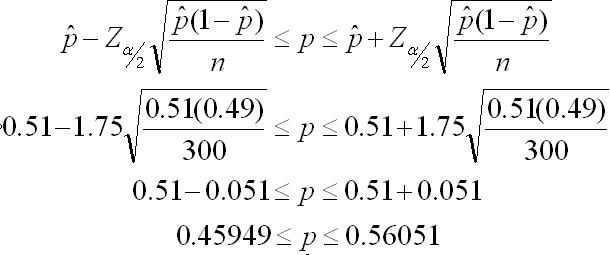
The Confidence Interval states that with 92% confidence, the proportion of all similar companies with the plan will between 46% and 56%.
The above equation is most effective for an approximation when
- Sample Size (n) >30
- The Population size is much greater than Sample Size
- The values (n*p-hat) and n(1-p) are both >5
- The population is much greater than n
Click here for more about calculating confidence intervals for means & standard deviation.


Templates, Tables, and Calculators
Six Sigma Practice Certification Exam
Subscribe to access this entire site
Recent Articles
-
Process Capability Indices
Oct 18, 21 09:32 AM
 Determing the process capability indices, Pp, Ppk, Cp, Cpk, Cpm
 -
Six Sigma Calculator, Statistics Tables, and Six Sigma Templates
Sep 14, 21 09:19 AM
 Six Sigma Calculators, Statistics Tables, and Six Sigma Templates to make your job easier as a Six Sigma Project Manager
 -
Six Sigma Templates, Statistics Tables, and Six Sigma Calculators
Aug 16, 21 01:25 PM
Six Sigma Templates, Tables, and Calculators. MTBF, MTTR, A3, EOQ, 5S, 5 WHY, DPMO, FMEA, SIPOC, RTY, DMAIC Contract, OEE, Value Stream Map, Pugh Matrix
Recent Articles
-
Process Capability Indices
Oct 18, 21 09:32 AM
Determing the process capability indices, Pp, Ppk, Cp, Cpk, Cpm -
Six Sigma Calculator, Statistics Tables, and Six Sigma Templates
Sep 14, 21 09:19 AM
Six Sigma Calculators, Statistics Tables, and Six Sigma Templates to make your job easier as a Six Sigma Project Manager -
Six Sigma Templates, Statistics Tables, and Six Sigma Calculators
Aug 16, 21 01:25 PM
Six Sigma Templates, Tables, and Calculators. MTBF, MTTR, A3, EOQ, 5S, 5 WHY, DPMO, FMEA, SIPOC, RTY, DMAIC Contract, OEE, Value Stream Map, Pugh Matrix -
Six Sigma, Six Sigma Training, Courses, Calculators, Certification
Aug 15, 21 10:27 PM
 One site with the most common Six Sigma material, videos, examples, calculators, courses, and certification.

Site Membership
LEARN MORE
Six Sigma
Templates, Tables & Calculators
Six Sigma Slides
Green Belt Program (1,000+ Slides)
Basic Statistics
Cost of Quality
SPC
Control Charts
Process Mapping
Capability Studies
MSA
SIPOC
Cause & Effect Matrix
FMEA
Multivariate Analysis
Central Limit Theorem
Confidence Intervals
Hypothesis Testing
Normality
T Tests
1-Way ANOVA
Chi-Square
Correlation
Regression
Control Plan
Kaizen
MTBF and MTTR
Project Pitfalls
Error Proofing
Z Scores
OEE
Takt Time
Line Balancing
Yield Metrics
Sampling Methods
Data Classification
Practice Exam
... and more