|

 content.")

C-Chart
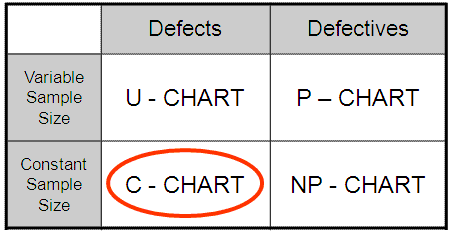
Attribute (Discrete) Control Charts
C-Chart is an attribute control chart used when plotting:
- DEFECTS
- POISSON ASSUMPTIONS SATISFIED
- CONSTANT (fixed) SAMPLE SIZE (subgroup size)
Develop upper and lower control limits (UCL and LCL) and determine the performance of a process over time. This chart plots the number of DEFECTS sampled, each observation is independent.
Used to detect shifts >1.5 standard deviations. In order to detect smaller and quicker shifts there are other time weighted charts that can be applied to variable and attribute data such as Exponentially Weighted Moving Average (EWMA) and Cumulative Sum of Quality Characteristic Measurement (CUSUM).
If the defect level is small, use the Poisson Distribution exact limits, DPU < 1.5.
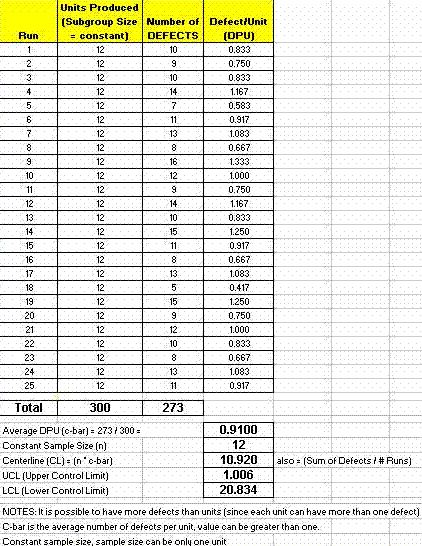
Shown below is a sample of data taken from 25 runs of a constant sample size.
In all the runs, we sampled 12 widgets. In the first run, there were 10 DEFECTS found among the 12 widgets.
It does not say if all 10 DEFECTS were found in one widget or which amount, it simply says 10 in total were found between all 12 samples in Run #1.
The chart below is the C-Chart representing the data shown above.
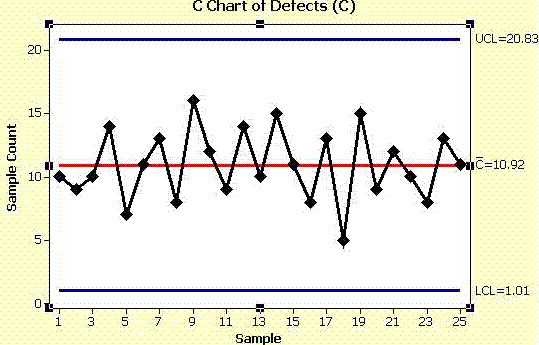
The chart indicates that the process is in control. The control tests that were used all passed in this case.
Recall there are a variety of control tests and most statistical software programs allow you to select and modify these criteria.
Review of the other three Attribute Control Charts:
Return to the Six-Sigma-Material Home Page
Recent Articles
-
Process Capability Indices
Oct 18, 21 09:32 AM
 Determing the process capability indices, Pp, Ppk, Cp, Cpk, Cpm
 -
Six Sigma Calculator, Statistics Tables, and Six Sigma Templates
Sep 14, 21 09:19 AM
 Six Sigma Calculators, Statistics Tables, and Six Sigma Templates to make your job easier as a Six Sigma Project Manager
 -
Six Sigma Templates, Statistics Tables, and Six Sigma Calculators
Aug 16, 21 01:25 PM
Six Sigma Templates, Tables, and Calculators. MTBF, MTTR, A3, EOQ, 5S, 5 WHY, DPMO, FMEA, SIPOC, RTY, DMAIC Contract, OEE, Value Stream Map, Pugh Matrix -
Six Sigma, Six Sigma Training, Courses, Calculators, Certification
Aug 15, 21 10:27 PM
 One site with the most common Six Sigma material, videos, examples, calculators, courses, and certification.

Site Membership
LEARN MORE
Six Sigma
Templates, Tables & Calculators
Six Sigma Slides
Green Belt Program (1,000+ Slides)
Basic Statistics
Cost of Quality
SPC
Control Charts
Process Mapping
Capability Studies
MSA
SIPOC
Cause & Effect Matrix
FMEA
Multivariate Analysis
Central Limit Theorem
Confidence Intervals
Hypothesis Testing
Normality
T Tests
1-Way ANOVA
Chi-Square
Correlation
Regression
Control Plan
Kaizen
MTBF and MTTR
Project Pitfalls
Error Proofing
Z Scores
OEE
Takt Time
Line Balancing
Yield Metrics
Sampling Methods
Data Classification
Practice Exam
... and more