|

 content.")
Kanban - Pull System
A search on the web will yield numerous Kanban card calculations for a pull system. There are many that are correct and many that are incorrect. The calculation can become very confusing quickly. There are also different formulas for different applications. This module strives to simplify them to the most common applications and formulas. Shown below is a basic pull system loop within a Value Stream Map.
") Kanban at Six-Sigma-Material.com
Kanban at Six-Sigma-Material.comThere are three types of PULL SYSTEMS covered below:
1) Production Kanban - this type of system contains cards that give the approval to produce (process, manufacture, or assemble) based on the need of the next operation since there was consumption that needs to be replenished.
2) Move Kanban - this type of system contains cards that give the approval for material to move from staging (or a storage location) to be produced (processed, manufactured, or assembled) since there was consumption that needs to be replenished.
3) External Supplier Kanban - this type of system contains cards (or some type of signal) that give the approval to ship, transport, or freight material from a supplier to the customer since there was consumption at the customer (which could be a distribution center fed by manufacturing plants) that needs to be replenished. This system replaces a forecast.
Just with any metric or output, there are a number of inputs and the amount that those inputs affect the output depends on your application...Y= f(x1,x2,x3...xn).
Our recommendation is, once you think you have determined the number of cards needed for the pull system, to try and model the pull system on your desk or computer with shortened, but same scale, parameters. Try out various scenarios and run a few cycles using all the cards. Conducting a quick reality check on your calculation will save time for everyone and provide a chance to refine before implementing.
Questions that create variations in the formula are:
- Is the application internal only?
- Does it rely on any external suppliers, how many suppliers?
- Is the demand from one customer or Several customers?
- In what pattern do they pull?
- Are there future pattern changes?
- How well are we in tune with key customers creating the demand?
- How will the re-order process be performed?
- How will replenishing work and the timing?
This page will explain some of the variables that should be considered. Once you are more comfortable with the topic you can optimize and create an equation that works best for your situation.
Strive to account for dynamic changes. A long term sustainable Kanban system requires accounting for the variation in lead time due to internal factors and external factors that are often changing, especially if there are numerous suppliers, machines, operators, involved.
Demand also changes over time. Demand is one major factor in the equation that is often (mostly) out of the control of the supplier. The best place to get demand is from historical records. Forecast accuracy depends on your suppliers but usually they are prone to error and also constantly changing.
Most Kanban formulas simply factor in variation as a percentage and it is an estimate to cover all elements of risk. This percentage is an insurance policy to cover the sins of the 7-Wastes, system variation, or unexpected growth (not always a bad thing). It is rare to have a system that performs perfectly all the time, meaning with zero insurance stock and has zero instances of running out of stock or building excess stock.
It is highly likely that some percentage of insurance is acceptable. While it is good to account for the risk, a small error in this estimate can have sizable implications.
Whenever available, use data to support the estimate for safety and buffer stock (aka insurance stock). As a GB/BB, attempt to gather data to assess the amount of variation from the inputs (machines, tugger routes, supplier delivery times) and apply objective rationale.
This also helps to create a dynamic Kanban system that recalculates the number of cards necessary by accommodating for changes in performance and demand. This way you optimize the time when inventory can be lowered and protect against risk when inventory should be raised (until the problems are resolved and levels come down again).
A Kanban system involves the purposeful placement and agreement to use a calculated level of inventory and specific locations for the purpose of just-in-time manufacturing (or flow).
This takes away the ability of someone stating "Lower Inventory because I said so and everyone else is...we are going to be Lean!".
NO...such statements are a recipe for disaster. This is not a personnel decision. Inventory is not a dial that is turned up or down at any time to any level. Kanban levels, inventory levels, should be driven by math and objective formulas. Inventory levels are an output that is data driven.
In other words, they are a function of their inputs. The output is not defined, it is calculated. Define and control inputs to help get to the desire output.
Inventory levels shouldn't be driven by a mandate from someone in the company without it being supported with data on the inputs to support that it is achievable. That energy needs to be shifted to control and improve the inputs and let the inventory levels float as they should and agree to hold and budget for those levels of inventory.
Again, not all inventory is bad inventory. Moreover, there may be periods when inventory needs to be increased to cover for unusual spikes, permanent growth, or temporary manufacturing or supplier issues while they are in the process of being resolved.
Kanban - Basic Formula

Insurance Stock refers to Safety Stock and Buffer Stock which are discussed later. The will be represented by a percentage, not to exceed 100% (or 1.0)
The Demand * Lead Time / Container Qty is the minimum amount of cards to cover the Loop Stock required for a pull system with no variation.
Always round up to the nearest Kanban regardless of final decimal value.
The number of Kanban cards means that this many cards (tags, containers, etc) need to be within the loop to maintain Just-In-Time Manufacturing flow. The loop, or circuit, includes all upstream and downstream operations that are involved within the loop.
The cards will be constantly moving from the collection post(s) and other operations but the total amount of cards should not change.....at least until the calculated number changes due to a input variable change.
Lets discuss the INPUTS
Keep in mind there are several key words that should raise a flag due to risk associated.
DEMAND:
- This unit of time must match the unit of time used in the Lead Time discussed next (such as days, hours, minutes, weeks).
- Be careful when using averages. Recall, the average may not be the best or only measure of central tendency to evaluate. Assess the demand for normality and review if normality assumptions apply.
- If so, use the average. If not, consider using the median demand value. For this module, the average is used in the examples.
- Forecast are always changing and often they are wrong. There are numerous companies or people that claim to have the best forecasting software but it is simply not possible to predict the future. What is known, is the historical demand. When possible use the history with some consideration of the future demand to determine the value used to input for DEMAND. Such as an average of the last 8 weeks and next four weeks of forecast.
- Some consideration to the future must be done to keep an eye out for special cause such as spikes, severe declines, or errors. Depending on the lead time to produce the product, you may have to take into account more or less time from the forecast.
- If you have one customer, one supplier, and they have prepaid for a batch of parts, then it might be best to produce and ship the entire at one time. There is no place for a Kanban system if it is a unique part, runs on unique machine, or of its own family. This is called a "Stranger" part and should be "built-to-order".
LEAD TIME:
- Again, this unit of time must match the unit of time used to determine the average demand discussed above (such as days, hours, minutes, weeks)
- Be careful when using averages. Recall, the average may not be the best or only measure of central tendency to evaluate. Assess the demand for normality and review if normality assumptions apply.
- If so, use the average. If not, consider using the median lead time value. For this module, the average is used in the examples.
- The Lead Time must consider the time to gather the signals (such as the cards from the collection post), time to place to order, processing time for the order and overall time to replenish the order if the machines or process runs other parts.
INSURANCE STOCK: SAFETY and BUFFER STOCK:
There are a couple types of "insurance" stock to account for two types of variation. These are insurance pieces that are planned into the pull system that are above and beyond the minimum required WIP market stock.
In a perfect system that never has, or ever will, have variation, then these two types of insurance are irrelevant. However, in reality some factor of insurance is highly likely. In a perfect system without any demand variation or lead time variation, the formula becomes simply the required WIP market stock divided by the container quantity.
In reality, most often there is variation within BOTH of the inputs: Demand & Lead Time.
It doesn't matter which term is used for each type, rather that that terms are defined for your system and ensure everyone understands the definition. A % of variation needs to be assigned to each to allow the system has additional, planned, inventory to run an effective pull system.
One type of insurance is related to covering internal manufacturing variation and the other type is related to downstream customer pull variation (or supplier and logistics variation if creating an External Supplier loop).
Buffer Stock (BS)
This insurance of additional pieces covers variation induced by downstream customers in the loop, also referred to as Demand variation. This stock is required and represent planned additional pieces for the pull system to cover for variation in customer demand.
Recall that a forecast is being replaced by these Kanban cards and with a well-run pull system the suppliers, or upstream operations, are only producing to replenish what was consumed upstream.
If the upstream operation has instances of abnormally high consumption then this buffer stock is supposed to cover those instances. A study of the consumption history (not the forecast) will show the true behavior, mean, median, and variation. This will help determine a percentage to add for this upstream demand variation.
When referring to a External Pull System and there are suppliers involved (which could be internal or external), the insurance stock is referred to as Buffer Stock.
Safety Stock (SS)
This insurance of additional pieces covers variation from the process, manufacturing operation, or internal movement event. Most processes do not produce the same exact output rate and quality yield rate every time they run the same part.
There will be instances of scrap and that scrap amount can vary from an average scrap rate. The same with the output rate (such as overall pieces/day, per hour, or per minute). There will be output variation from performance and various sources of downtime. The run rate and the amount of downtime each time the parts are produced will vary from an average.
The Safety Stock % includes the Buffer Stock since the average demand + demand variation coverage (which is the buffer stock) all have to be produced on the machine, or moved for "move" system.
This stock is also added to account for this variation. This stock is required and planned additional pieces for the pull system circuit to cover for the variation in processing.

"Production" Card Kanban Calculation
The relevant information needed is:
1. Average Demand (D)
2. Amount of time Kanban card to get to front of the line (KT). In other words, the time for a complete cycle of a card.
3. Processing Time (PT): Time to finish one container of parts including set-up time. Look for history that has set-up time and other downtime to get a average PT for a specified container quantity.
4. Container Quantity (CQ): Pieces in a container
5. Buffer Stock % - expressed as a % of Demand variation (BS%)
6. Safety Stock - expressed as a % of Process Variation (SS%).
The Safety Stock is added to the required total WIP stock level plus the Buffer Stock. In other words, it is variation within Demand and creates additional variation in the manufacturing Process Time for a cumulative effective on the necessary Safety Stock required.
EXAMPLE:
The customer uses an average of 80,000 pieces / day with a variation of 30%. The operation producing these parts runs 10 hrs / day. Each Kanban container contains approximately 25,000 pieces. It takes 150 minutes to produce (or process) a container of parts. However, the part is produced on a machine that has other parts to produce so it is ran once every other day (every 20 hrs). A Safety Stock of 10% is assigned to cover the Production Time variation (i.e. the variation in KT+PT).
NOTE: D, KT, and PT must be expressed in same unit of time (such as per week, per day, per hour, per minute)
D: 8,000 pieces / hour
KT: 17.75 hours
PT: 2.25 hours (45 minutes) for one Kanban container
The part is ran every other day and each day has 10 hrs for a total of 20 hours of machine time. It takes 2.25 hrs to make one container quantity.
CQ: 25,000 pieces
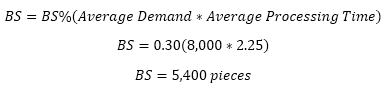
BS%: 0.30 (30%)
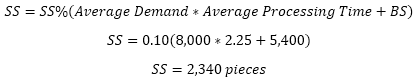
SS%: 0.10 (10%)
The minimum stock needed for the system (without BS or SS insurance stock) = D * KT. However, for the system to function properly the insurance stock needs to be added to formula.
Calculate Buffer Stock (BS):
Calculate Safety Stock (SS):
Production Card Formula
The sum (KT+PT) represents the Lead Time (LT).
Substitute the values above into the formula below. The numerator represents the total amount of pieces the system needs based on the inputs above.

The insurance stock = 5,400+2,340 pieces which is 7,740 pieces or about a third of an extra container of parts to cover for demand and processing time variation.
For a perfect system with no variation, the number of pieces required in the loop would be 160,000 pieces or 6.4 cards. So, this also rounds up to 7 cards (or containers) that would still be required in the loop.
However, if the CQ was 10,000 pieces then the perfect system would function with exactly 10 cards. However, the insurance stock results in another 7/10 th's (1 more) of a container meaning that 11 cards (or containers) would be required for the system.
Thinking about the variables in the numerator, it is evident that a statistically proven reduction in variation (insurance stock %), or the average processing time itself, can reduce the need to have so much inventory in the loop. And, of course, a drop in the average demand will lead to a lower number but it is doubtful that is the method any company wants to drive a reduction in inventory dollars (an continuous variable such as DIOH will still remain the same).
But don't force the number of cards (amount of inventory) to be a certain number unless that data and formula support the case.
As companies reduce lead time and get faster at converting their product to revenue, their should be an emphasis on reducing the container quantity to help material flow quicker and utilize containers to fullest capacity.
What is the maximum quantity that will be on hand in the example above?
Within the entire loop, regardless of where the cards are at any given time, there are 7 cards. With each card representing one container there will be 7 * 25,000 pieces = 175,000 pieces at most in the system.
What is the maximum number of days that will be on hand in the example above?
Within the entire loop, regardless of where the cards are, there are 7 cards with 175,000 pieces. Provided a customer average for daily demand being 80,000 pieces, there will be a maximum of 2.19 days on hand.
The 0.19 days is the insurance amount of days on hand.
"Move" Card Kanban Calculation
The relevant information needed is:
1. Average Demand (D)
2. Amount of time (same unit as D) to obtain a replacement container of parts (MT)
3. Container Quantity (CQ)
4. Buffer Stock % - derived from formula above % of Demand variation (BS%)
5. Safety Stock % - derived from formula above % of Move Time variation (SS%)
The Safety Stock is added to the required total WIP stock level plus the Buffer Stock. In other words, it is variation within Demand and creates additional variation in the Move Time for a cumulative effect on the necessary Safety Stock required.
EXAMPLE:
The customer uses an average of 80,000 pieces / day with about 10% variation. The operation producing these parts runs 16 hrs / day. Each Kanban container has a standard pack of 2,000 pieces. It takes the tugger route 45 minutes to replace a container of parts. A Safety Stock of 25% is assigned to cover the Move Time variation.
D: 5,000 pieces / hour
MT: 0.75 hours (45 minutes)
CQ: 2,000 pieces
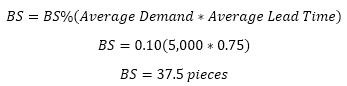
BS%: 0.10 (10%)
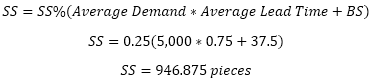
SS%: 0.25 (25%)
The first step is to determine the insurance stocks to get the total number of pieces. Then divide that total amount of pieces by the amount of pieces for each container (or sometimes called the standard pack quantity) to get the number of cards needed. The numbers are shown in exact figures with the rounding done at the end.
Calculate Buffer Stock (BS):
Calculate Safety Stock (SS):
Move Card formula
Substitute the values above into the formula below. The numerator (4,735 - rounded up) represents the total amount of pieces the system needs based on the inputs above.
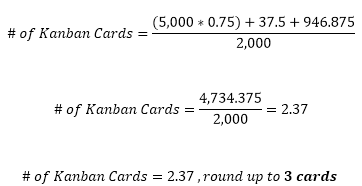
The entire "move" loop requires 3 total cards. Notice, that the rounding impact in this example did not have an effect on the final number of cards needed. However, it could have if the CQ was much smaller.
"External Supplier" Kanban Calculation
Once a supplier or a
freight movement is involved there is additional risk. The Safety Factor is a
critical variable to get correct. The determination should first be evaluated
using historical data to understand the mean, median, and variation.
Most often, depending on geography, distance, weather, regulations, and other factors using an external supplier involves a higher Safety Stock % than a "Move" or "Production" Kanban system.
Lets use a simple example to help visualize the calculation. Let's say there is a vending machine with various items from drill bits, batteries, safety glasses, and gloves. The same vendor supplies all the items and has committed to optimal pricing; however, they will only deliver once week and it could be anytime on the 7th day. This is called Fixed Frequency replenishment plan which is discussed later.
The supplier gets an electronic signal instantaneously whenever an item is released from the vending machine. The supplier replenishes what is consumed through 5 weekdays after replenishing the machine because it takes up to 1 full day to travel and restock the machine although the average time is 12 hours and has been a low as 6 hours.
How much of each item has to be in the vending machine?
You could think to yourself that it depends on how much on average are used per 7 days of each item. While that is correct, it also depends on how quickly and and how reliable the supplier of delivering at the same time on the 7th day. In other words, if the supplier can not be relied upon to deliver at the same exact time window early in the 7th day, then plan for the worst case which is to cover enough stock for the entire 7th day of usage. This accommodates for the variation.
In this example, we assume the Order Time (OT) is instantaneous. Also, the Container Quantity (CQ) is one since each battery (drill bit, set of safety glasses, or glove) is one Kanban signal or card.
Let's just focus on the
Kanban level for one item, batteries. The inputs of importance are the average
daily usage of batteries and the variation of that usage.
From a replenishment perspective, the Order Time, Supplier Production Time, and Supplier Replacement time (which includes freight to the customer and restocking time).
The sum of all those components of time is the total "Lead Time" that will be applied in the Basic Formula above. Also, just as important is the variation in this total Lead Time.
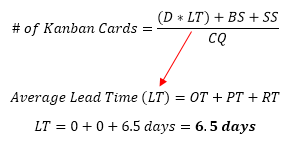
Lead Time = Order Time + Supplier Production Time + Supplier Replacement Time
The relevant information needed is:
1. Average Demand of each item per unit of time (D)
2. Time to receive and for supplier to acknowledge the order (OT)
3. Time for supplier to produce a Kanban item (PT)
4. Replacement Time (RT)
5. Average Lead Time (Average of OT+PT+RT)
6. Container Quantity (CQ):
7. Buffer Stock % - expressed as % of Demand (Usage) variation (BS%)
8. Safety Stock % - expressed as a % of Lead Time variation (SS%)
Lets says the data shows that 16 batteries are used on average per / day and the data is adheres to a normal distribution. There is usage variation of 5%.
The supplier producing these parts receives the orders instantaneously and has committed to always having the batteries in stock and the historical performance indicates that is proven to be the case.
It takes on average 12 hours to drive to customer and replace the stock in the vending machine. But it has taken up to 24 hours and it is very important that the customer does not run out of batteries. However, they are very expensive so it also important not to carry excess inventory.
The company runs 24 hours/day, 5 days/week, and 16 hours/day for a total of 80 hours/week or 7-day period The supplier or customer does not work on Saturday and Sunday. The supplier delivers on a Tuesday every time.
D: average use of 16 batteries/day or 80 batteries/week (or over a 7-day period).
OT: 0 (instantaneous electronic Kanban signal back to supplier)
PT: 0 (supplier committed to always have stock of batteries)
RT: 6 days + 12 hours = 6.5 days
CQ: 1 (each item acts as its own Kanban "card" and delivers electronic signal to supplier when is dispensed from the vending machine)
BS%: 0.05 (5%) - expressed as a % of the battery usage variation per week.
SS%: 0.20 (20%) (using worst case scenario since it is critical not run out of batteries)
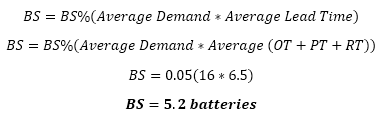
Calculate Buffer Stock (BS):
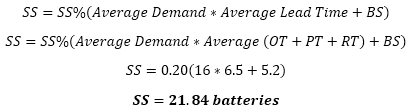
Calculate Safety Stock (SS):
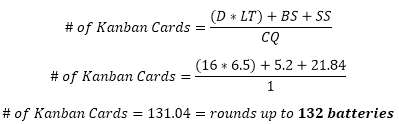
External Supplier Card Formula
Takeaways
If the batteries were delivered in sealed packages of 4 each, then the CQ = 4. And the total number of Kanban "Cards" equals 32.76 which rounds up to 33 packs of batteries.
The only change is in the denominator where the 1 changes to 4. Instead of 132 individual batteries, the formula says we need to have 33 packages of 4 batteries in each package.
In reality, most of the situation is more complex in the following ways:
The supplier may not always have the items in stock and the order time may not be instantaneous. In those cases, the data will have a mean and variation. It is important to consider BOTH in the Lead Time. The SS% needs to account for the total variation from the OT+PT+RT.
Often the Production Time (PT) involves processing parts that are shipped to a supplier. The processing can not begin on a particular container until the container arrives at the supplier.
Furthermore, batteries are normally very consistent in their performance and reliability. In reality, the supplier processing material may create scrap or rework resulting in further Buffer Stock and a high BS%. This material has to be reproduced from the beginning or reworked from a previous step, either way it cost lead time, pieces.....and money.
Another variable that can often be negotiated with an external supplier is the freight frequency or replenishment frequency. Perhaps, shipping costs are low and inventory costs is very high so the company wants to ship batteries in 2x/week and will restock the vending machine on their own. The worst case scenario could be 4 full days of coverage in the vending machine instead of 7.
Pitfalls of Kanban Calculations
Even when you understand the application, the formula seems relatively simple yet so many Kanban systems fail due to oversight of the inputs and most common "what-if" scenarios. Listed below are some common pitfalls of a Kanban card calculation.
Wrong Measure of Central Tendency
A lot of Kanban calculations rely on AVERAGES......such as average daily demand and average lead time.
As a GB/BB, review the data for normality. If the data can not be assumed to fit a normal distribution (or can not be assumed normal) then the average may not be the best measure of central tendency to use and the median should be applied.
Furthermore, the data may exhibit normality now, but what if it changes and then the median becomes more suitable. The best way to handle this is the create a "what if" calculation in your Kanban calculation spreadsheet.
- If the p-value drops below 0.05 (or whatever your level of significance is determined to be) then the median is used.
- As long as the p-value exceeds the Level of Significance (alpha risk), then the data is normal and the average is applied to the formulas.
Once the spreadsheet is created with all these calculations and data points the calculations will be automatic and quick. It may seem complex to begin with but creating this type of spreadsheet will provide better results in the long run.
However, if the variation is excessive and the inputs are not in control, there is a high likelihood that the pull system will not work. This applies to variation in customer demand and insurance stock. Do not waste time trying to implement and shoehorn a pull system until the variation is under control.
Static System
One shortfall found within Kanban card calculations is that the formulas are not dynamic. In other words, the inputs are static and fail to continuously keep up with real time data and show that an adjustment to the number of cards is needed for the loop. The inputs change over time. Emergency fill cards should be used in the short term if there is a part shortage but if the inputs have changed and it appears they will change for the long term then the number of true cards should change.
They work great for the current state, or short term, then as soon as historical demand and future demand, or lead time, change, then the number of Kanban cards needs to adjust accordingly. The static system works for the short term but is destined to fail in the long term. The pull system will eventually either over produce (if demand or lead time decreases or their variation decreases which means the % of insurance should be reduced) or be constantly filled with Emergency Fill cards (if demand or lead time increases or their variation increases which means the % of insurance should be increased).
Too Large of Loop
Some loops or circuits are too long or large. This is a subject term but when a loop spans across mulitple operations, operators, machines, workcells, suppliers, sub-suppliers, then the risk multiplies and the safety and buffer factors grow significantly and it is harder to quantify this multiplying effect.
Keep loops small and manageable to allow the best chance for the system to flow with an accurate number of cards in the long term. A large overarching loop or pull system should be made of several smaller loops. In other words, implement small pull systems within a large or complete part of a value stream rather than a signal to start production across multiple operation, suppliers, and locations....which is too complicated. Yes, this is more work to create up front, but will offer more stability and success in the long run.
Several small loops allows easier troubleshooting if there is a shortage or excess in the value stream. Imagine if your loop spans 5 operations and 3 suppliers versus two operations and one supplier. It is much easier to determine sources of variation and refine the values used in the formula.
The simplest pull system is a two bin (container) system where all the cards are in one of two locations. Try to keep it simple with manageable loops.
Poor Quality History
Part or components that have poor quality history (or low yield) are not good candidates for a Kanban system. Again, this adds more variability and risk so the insurance stocks must increase to account for worst case (low yield situations) or they system will run out and downtime will be a result.
Kanban systems require stability in all facets of the loop. The team (or a new team) needs to get the quality performance of all parts and suppliers under control before implementing this system. The quality performance (or lead time) may not be what you want it to be, but as long as it is in statistical control then the system will work. The team can work on shifting the target (what you want it to be) as another project.
Build to Order
Parts that are unique, run on unique machines that aren't shared with other products or have little overlap, spot buy, or highly infrequent purchase, or have been pre-paid are not good candidates for Kanban. If possible, build these orders as they arrive in one batch and ship as one batch. These are known as "build-to-order" parts.
Kanban Cards

Cards styles come in a near infinite variety. Moreover, Kanban signals do not have to be cards. Other forms of signals are e-messages, automatic shipment notices (ASN's), containers, lights, etc).
Sometimes it isn't practical to take cards across the loop. Such as if there is a long freight move among suppliers. The movement of physical cards may be too risky as they may get lost, damaged, etc. The point is to make the signal as visible and real-time as possible to the affected operations when the market is full and when it needs to be replenished.
Emergency Fill Cards:
There are also emergency Kanban fill cards where if the system is found to not have enough cards to maintain flow of production, then a supervisor or Production Control, can enter a card to the system.
If a loop is created that requires 12 cards and later in the month there is a shortage and a 13th card is needed, then it is entered as a designated as an Emergency Fill Card. Follow this up with a review with the stakeholders to understand what input changed.
This can be a result of special cause variation in the demand or lead time or simply the average is no longer suitable (read above). If it is found the extra card is needed for a long period of time, then the inputs to the calculation need to be reviewed and updated.
This type of card may also be used if there is an unexpected scrap or quality containment event that effectively removes stock from the the loop.
Temporary Fill Cards:
These cards should be managed by the Process Owner too. These are used in the event a Kanban card is lost or misplaced. This fill card should be identified clearly so if the lost card does get located then the temporary card is removed.
These cards are also used for sample runs, pilot jobs, usually of smaller quantity than a regular lot or a container size.
An audit should be conducted periodically to ensure all the cards are in the system and in the appropriate locations. Also, check for the card condition. Replace any cards that are destroyed on not legible.
Audits and the use of any Emergency or Temporary fill cards should be documented.
Sample Kanban Card
|
|
Click here to download a sample card. There are also additional comments within the cells. |
Kanban Signals in a VSM
 |
Click here to order various Value Stream Mapping symbols that include those related to Kanban and Pull Systems. |
Collection Post

Another consideration when implementing a Pull System with Kanban is when to reorder or determining the order cycle.
A "collection post" can be an actual collection center for Kanban cards or it may be a lane or staging area. Sometimes, such as in the above example for the vending machine, there is not a physical collection post since the signal is sent to the supplier electronically. The collection post is on a software system and the supplier replenishes the amount consumed each week.
A few options of reordering:
1) Fixed Frequency: Order at a designated interval of time regardless of how many cards or signals are at the post.
2) Fixed Quantity: Reorder when there is a fixed and predetermined quantity of cards or signals in the post. Perhaps, there is a discount from a supplier if ordered in a specific amount or there is a more efficient handling system with a certain amount instead of moving one or two at a time.
3) Fixed Level: Reorder when the remaining cards reach the Safety Stock threshold.
4) Instantaneous: Reorder as pulled or consumed. Vending machines and VMI systems are often equipped with electronic notifications to send signals to tuggers or vendors to replenish.
Note:
For all of the above options, the re-order timing can be instantaneous but the lead time in the formula to calculate the number of Kanbans must be when the material is actually replenished. Ordering is only part of the responsibility for the Kanban system. The other part is replenishing on-time, as planned. The Lead Time must consider both of these elements.
Pull Board
This is a visual board where the Kanban cards are placed from the collection post (or bin) that gives approval for that operation to produce for the downstream operation. The downstream operation now needs to be replenished.
The Pull Board is a visual management tool that drives production. It is also used in a variety of other ways to show more information. For example, a sticker, marker, can be added to show that the paperwork, tools, raw material, etc are ready for each job or card on the board. This tells a supervisor or operator that not only are the parts needed, but everything to make the parts is ready to produce the parts.
Once a Container Quantity is produced, then a Kanban card is fixed or attached to that container. That card travels with the material to the downstream operation and once that container is used or shipped then the cards goes back to the Pull Board and the cycle repeats itself.
|
|
|
Considerations
Here are a few additional considerations and notes:
- Implementing a perfect Kanban system upon launch is a lofty expectation. However, it is better to launch a program that is reasonable than delay repeatedly to get to perfection. What is perfect now, will likely not be perfect over time. As time progresses, you can add barcoding, dynamic systems to create real-time calculations, and use other measures to indicate trends, etc. The point is to get started, tweak, and stick to the system.....sounds like continuous improvement.
- If the tugger route or shipments are added at a higher frequency then there is a cost associated. Sometimes it is easy to measure the direct impact such as labor, more freight, more packaging supplies. Other times the cost are indirect or not so obvious, such as depreciation on material handling equipment (wear and tear), time to package material more frequently, traffic in a congested area, and overall reliance on suppliers to execute JIT and hit their delivery windows.
- The pack quantity must remain consistent for a given number of calculated Kanban cards. In some bulk processing applications for items such as nails, or small items made in large quantities it may only be practical to get rounded values or use weights instead of counts. In any case, ensure the estimated pack quantity stays relatively consistent to ensure the Kanban card calculation remains relevant.
- If the pull system can run the risk of running out, meaning the customer may not have stock available when they want it or a line may be down, then obviously more risk can be taken and cards removed from the system. This offers the benefit of more immediate working capital but at a risk of lost sales, profits...and working capital in the future. You can lower or eliminate the SS and BS levels first and then the next level of risk would be reducing the normal required minimum cycle stock of D * LT.
Other Calculations
There are several ERP systems from SAP, Oracle, Plex, Aptean, QAD that use Kanban formulas within there software (these formulas may change over time).
Oracle uses a calculation of:
(C - 1) * S = D * L or C = ((D * L) / S) + 1
where:
C is the number of Kanban cards
S is the kanban size (or Container Quantity)
D is the average daily demand
L is the lead time (in days) to replenish one kanban
The addition of 1 is similar to an insurance stock but using a fixed value of adding one additional card to the perfect system.
Learn more about Oracle's formula by clicking here.
SAP uses a default calculation of:
# of Kanban Cards = (RT * AC/CONT) * (SF+SB)
where:
RT is the replenishment time per container, including the pull interval
AC is the average consumption unit per time
CONT is the container quantity, kanban quantity
SF is a Safety Factor with default of 1
SB is the buffer from supply source
There is also a constant "C" in the formula that defaults to zero
Learn more about SAP's formula by clicking here
Templates, Tables, and Calculators
Online Six Sigma Certification options
Return to the Six-Sigma-Material.com Home Page
Recent Articles
-
Process Capability Indices
Oct 18, 21 09:32 AM
 Determing the process capability indices, Pp, Ppk, Cp, Cpk, Cpm
 -
Six Sigma Calculator, Statistics Tables, and Six Sigma Templates
Sep 14, 21 09:19 AM
 Six Sigma Calculators, Statistics Tables, and Six Sigma Templates to make your job easier as a Six Sigma Project Manager
 -
Six Sigma Templates, Statistics Tables, and Six Sigma Calculators
Aug 16, 21 01:25 PM
Six Sigma Templates, Tables, and Calculators. MTBF, MTTR, A3, EOQ, 5S, 5 WHY, DPMO, FMEA, SIPOC, RTY, DMAIC Contract, OEE, Value Stream Map, Pugh Matrix
Recent Articles
-
Process Capability Indices
Oct 18, 21 09:32 AM
Determing the process capability indices, Pp, Ppk, Cp, Cpk, Cpm -
Six Sigma Calculator, Statistics Tables, and Six Sigma Templates
Sep 14, 21 09:19 AM
Six Sigma Calculators, Statistics Tables, and Six Sigma Templates to make your job easier as a Six Sigma Project Manager -
Six Sigma Templates, Statistics Tables, and Six Sigma Calculators
Aug 16, 21 01:25 PM
Six Sigma Templates, Tables, and Calculators. MTBF, MTTR, A3, EOQ, 5S, 5 WHY, DPMO, FMEA, SIPOC, RTY, DMAIC Contract, OEE, Value Stream Map, Pugh Matrix -
Six Sigma, Six Sigma Training, Courses, Calculators, Certification
Aug 15, 21 10:27 PM
 One site with the most common Six Sigma material, videos, examples, calculators, courses, and certification.

Site Membership
LEARN MORE
Six Sigma
Templates, Tables & Calculators
Six Sigma Slides
Green Belt Program (1,000+ Slides)
Basic Statistics
Cost of Quality
SPC
Control Charts
Process Mapping
Capability Studies
MSA
SIPOC
Cause & Effect Matrix
FMEA
Multivariate Analysis
Central Limit Theorem
Confidence Intervals
Hypothesis Testing
Normality
T Tests
1-Way ANOVA
Chi-Square
Correlation
Regression
Control Plan
Kaizen
MTBF and MTTR
Project Pitfalls
Error Proofing
Z Scores
OEE
Takt Time
Line Balancing
Yield Metrics
Sampling Methods
Data Classification
Practice Exam
... and more