5S
|
The 5S's: 1. Sort |
5S was originally a Japanese organization method composed of the terms: seiri, seiton, seiso, seiketsu, and shitsuke. This methodology was a building block to allow Just-In-Time Manufacturing.
An additional "S" may be included to represent SAFETY. Safety is always a prerequisite for any project or event and should be reviewed at every stage. More recently there has also been an "S" for Customer "Satisfaction" and "Security"
The naming conventions are as not as important as taking each step in order and completing each before moving on the next.
The success of 5S is due to its simplicity, ease of understanding, quick impact, and universal applications. It can be applied in production areas, office areas, and information systems.
Workplace 5S reflects the company's overall performance and perception. The changes from a the program can reduce job hazards and improve safety in the workplace.
Sort (Seiri)
Perform a "red" tag event where all items in an area are tagged for a later discussion later with the stakeholders. All "red" tag items are taken to an area (if possible) and the stakeholders determine how to sort them (discard, store, keep).
Before the next step can start, remove unnecessary items for the workspace. Look for physical obstacles or safety issues and prepare to address them with the team and come up with solutions to remove or mitigate them.
Prevent the possibility of items being stored that don't belong. One clever idea to help emphasize this point is to minimize flat surfaces. Tops of cabinets, machines, support equipment tend to collect stuff. One idea is to create spherical surfaces or pointed (cone) tops to help curb this behavior.
Straighten (Seiton)
Arrange items in format that minimizes travel waste and provides optimal ergonomics. Items the are used less frequently should be placed further away than more frequently used items.
Furthermore, simply the method of getting tasks done, picking and placing items, and making it visual when something is out of place. Organize area for right size Kanban containers and for simple flow of materials in and out of the workspace.
Try to keep the talented personnel at their workstation at all times so their skillsets are most effectively used as much as possible.
Use standardized cabinets, containers, postings, quick-change handles, color-code schemes, tooling, and others. Make the workplace look connected, consistent, orderly, and presentable at ALL times (not just when "management" comes around).
Shine (Seiso)
This means to clean...intensely: Sweep, vacuum, degrease, paint, label, and going above and beyond the normal cleaning. This could mean replacing carpet, repairing sections of floor, improving lighting, replacing worn machine parts, removing or updating outdated postings, fixing leaks, and wide array of tasks.
Paint items a lighter color to expose leaks. The sooner a problem is known the quicker it can be fixed (bad news does not get better with time).
Raising cabinets, desks, benches off the floor and place on casters are ways to make the area easier to clean and sustain. Also using retractable hoses, electrical lines, tools suspended above, movable control stations, are a fe methods to reduce clutter and yet keep essential items nearby.
Standardize (Seiketsu)
Create color codes, common signage format, color scheme, font, and appearance.
Display a picture of the benchmark 5S for the area that display only an acceptance for high standards of maintenance.
Use common shadow boards at all machines, workstations, etc. with standardized arrangements. Use common handles, keyboards, labels, and/on lights, file naming conventions, work instruction format, workbenches, chairs, and so forth. The ideas are nearly infinite once the team dives deeper into thought for ideas (while being financially sensible and practical).
Not all standardization is visually obvious. Some are transactional in nature but the point is to simplify, reduce variation, and little up front investment of time will go a long way towards permanent efficiency gains.
Sustain (Shitsuke)
The program isn't over after a one-time successful event. Like any Six Sigma project, there must be controls and countermeasures defined. 5S uses an ongoing audit system.
That is often when the momentum starts and the engagement begins with many quick hits and positive physical changes. 5S is often one of the components in a Kaizen Event.
Audits should be conducted by unbiased employee(s) and owned by those that work and lead the area or department. EVERYONE in the workplace should have a responsibility and accountability to a specific area.
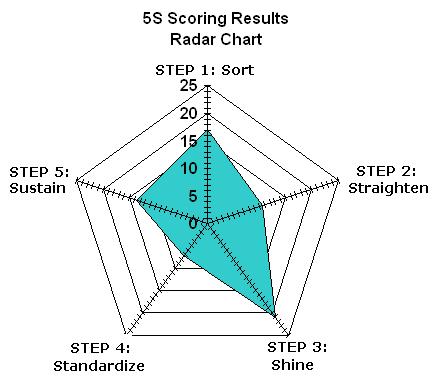
The results of an audit are most commonly shown using a radar chart as shown below.
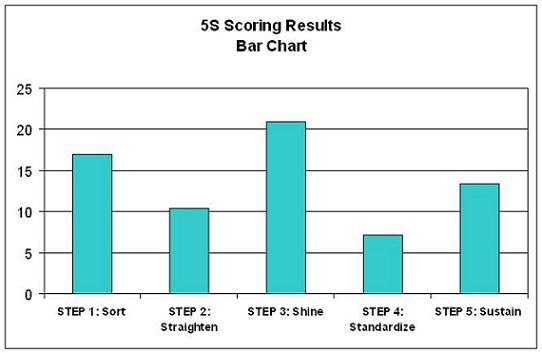
This type of chart can quickly be created using a software program, such as Excel. The results of the actual audit, improvement opportunities, and the charts should be placed on display in that area.
5S Tracking Template
A template and scorecard that automatically creates similar charts as shown below is available at Six-Sigma-Material/Templates
The 5S AUDIT
Scoring is subjectively assigned from 0 to 5 (as whole numbers) with the following guide.
0: zero effort, no evidence, not started
1: activity started with minimal effort but not sustainable
2: widespread activity with more opportunity for improvement
3: minimum acceptable level sustained for a month
4: all-encompassing activity and sustained for over a month
5: best-in-class and sustained for at least six months
5S Implementation Material
|
|
|
Benefits of 5S
Elimination of 7-Wastes
Clean and Organize
Workplace Ownership
Reduce Space
Better Morale
Efficiency Gains
Optimize Workflow
Lower Inventory
Increased Safety Performance
Templates, Tables, and Calculators
Test your knowledge with these sample certification problems
Return to the Six-Sigma-Material Home Page
Site Membership
LEARN MORE
Six Sigma
Templates, Tables & Calculators
Six Sigma Slides
Green Belt Program (1,000+ Slides)
Basic Statistics
Cost of Quality
SPC
Control Charts
Process Mapping
Capability Studies
MSA
SIPOC
Cause & Effect Matrix
FMEA
Multivariate Analysis
Central Limit Theorem
Confidence Intervals
Hypothesis Testing
Normality
T Tests
1-Way ANOVA
Chi-Square
Correlation
Regression
Control Plan
Kaizen
MTBF and MTTR
Project Pitfalls
Error Proofing
Z Scores
OEE
Takt Time
Line Balancing
Yield Metrics
Sampling Methods
Data Classification
Practice Exam
... and more


