5-WHY
The 5-WHY tool is used to find specific and systemic root causes
of a problem. It is also used to find detection failure causes. It may be used
several times in the MEASURE phase or in LEAN Manufacturing projects.
Objective:
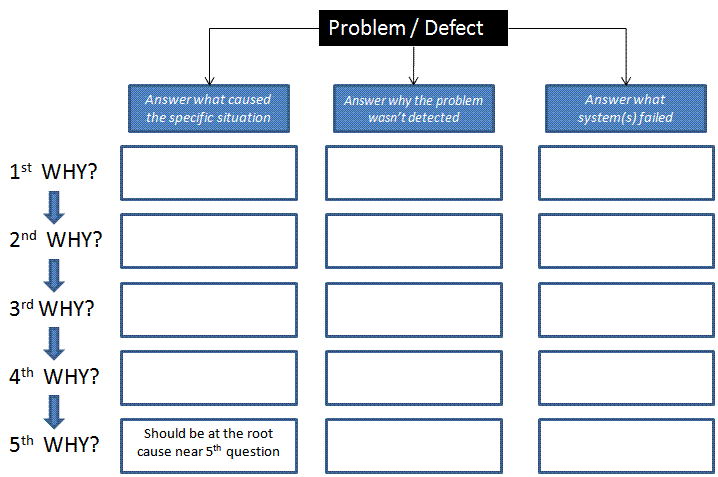
Start with the problem and analyze it from a prevention and detection perspective and continue to ask WHY to each previous answer until the root cause is obtained. The tool name suggests that repeating this process five times can get to the root cause.
It can take greater or fewer questions and sometimes it may branch
off in two or more directions. Keep drilling down until the real root cause(s)
is found. A review of Mistake Proofing is recommended prior to
using the 5-WHY tool.
This serves as a simple effective tool to begin the corrective and preventive action of any type of problem from injuries, quality defects, unplanned downtime, and rework.
Its goal is to do more than correct the obvious, but to dwell further into preventing it from happening again in the specific instance...and systemically across a company, group of machines, operators, set of forms, etc.
Getting to the root cause may take more or less than five questions. The point is to ask the difficult questions and get to the bottom of the problem. Only then can solid corrective actions for the immediate term and preventive actions for the long term be planned. It is more important to get the difficult, right solution than to run with the simple wrong.
This module is easy to explain but challenging to complete. It is key to gather all the inputs (x's) into your problem. These inputs, to some degree, are creating variation or moving the performance off the target. The quantification of this is done in the ANALYZE phase, first it is critical to obtain and document all of them.
The causes and root causes should also be linked into the Fishbone Diagram as the "bones"
of the fish skeleton.
- Assign ONE person to the corrective actions of each root cause.
- Assign ONE person to the preventive actions of each root cause.
- Agree on a specific completion date for each assignment.
- Record all the names of the people involved in the exercise.
- Record the date the exercise was completed.
This exercise should be done with those familiar and unfamiliar with the problem, 5-10 people. Those involved will present the most accurate review of the problem and those unfamiliar may have fresh perspectives and unbiased input.
Bottom Line!
As the team leader the goal is to PREVENT the problem from ever happening again and pursuit with this mentality until it is not economical or practical. Everyone must have it in their mind to implement actions to absolutely prevent the root cause from happening.
This is similar to when attacking high RPN's in a FMEA, specifically the OCCURRENCE scoring component.
THEN, if it cannot be prevented 100% of the time, go forward with the same aggressive mindset to DETECT the problem 100% if the time if it does occur.
If the root cause can still pass through, attempt to reduce the severity of the failure mode or its impact to the project output.
5-WHY Manufacturing Example
Supervisor: “Why did you slip and fall?”
Operator: “Because the floor has oil on it”
Supervisor: “Why was there oil on the floor?”
Operator: “I didn't notice it and didn't wipe it up”
Supervisor: “OK, but why and how did the oil get on the floor?”
Operator: “Because the machine has a leak”
Supervisor: “Why does the machine have a leak?”
Maintenance: “The connection to the pump is worn.”
Supervisor: “Why was the connection worn?”
Maintenance: “Hmmm...maybe it was overdue to be replaced”
Supervisor: “Let's investigate....where are the PM records? And does the PM checklist mention to check and/or replace the hose after a certain duration of time? Is it the correct hose? Is there a better quality hose?
Maintenance: "I don't know but we'll look into these questions.”
Supervisor: “Furthermore, do any other machines have the same hose and may the problem occur elsewhere?"
Maintenance: "If so, we will make the improvements across all applicable machines.”
Observations
The solution for one instance should be read across to the other machines and other factories within the company.
Ask more questions such as:
- Do the other machines have same problem?
- How can a leak be detected?
- How can the leak be prevented? Add to TPM program?
The 5-Why can lead to other paths and questions that need to be answered. Always ask the tough questions of how to PREVENT and DETECT the problem.
Perhaps the connection should be checked (or replaced with new) every so many hours. This interval could be defined within the machine preventive maintenance standard work.
There may be better technology or higher quality connectors or maybe the pump was vibrating excessively, or the connector wasn't installed properly.
For detection, is it possible that a pressure gauge could have been installed and set to shut down the machine if there was a sudden loss (or increase) in oil pressure.
All angles should be evaluated and documented.
It is NOT the job of the Six Sigma project manager to ask all these detailed questions or suggest answers. It is your job to get the right people that will have the knowledge and answers to fix the problem.
Your job is also to ensure that the root causes are captured, and all are address in terms of PREVENTION and DETECTION. Some responses will not be practical or even silly but that is the starting frame of mind.
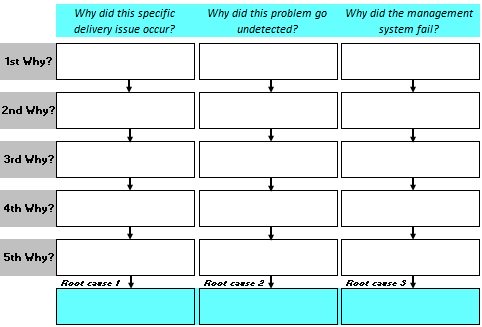
5-WHY Template
 |
|
Search for Six Sigma related jobs
Get access to all pages with Six-Sigma-Material.com
Templates, Tables, and Calculators
Return to Six-Sigma-Material Home page
Recent Articles
-
Process Capability Indices
Oct 18, 21 09:32 AM
Determing the process capability indices, Pp, Ppk, Cp, Cpk, Cpm -
Six Sigma Calculator, Statistics Tables, and Six Sigma Templates
Sep 14, 21 09:19 AM
Six Sigma Calculators, Statistics Tables, and Six Sigma Templates to make your job easier as a Six Sigma Project Manager -
Six Sigma Templates, Statistics Tables, and Six Sigma Calculators
Aug 16, 21 01:25 PM
Six Sigma Templates, Tables, and Calculators. MTBF, MTTR, A3, EOQ, 5S, 5 WHY, DPMO, FMEA, SIPOC, RTY, DMAIC Contract, OEE, Value Stream Map, Pugh Matrix

Site Membership
LEARN MORE
Six Sigma
Templates, Tables & Calculators
Six Sigma Slides
Green Belt Program (1,000+ Slides)
Basic Statistics
Cost of Quality
SPC
Control Charts
Process Mapping
Capability Studies
MSA
SIPOC
Cause & Effect Matrix
FMEA
Multivariate Analysis
Central Limit Theorem
Confidence Intervals
Hypothesis Testing
Normality
T Tests
1-Way ANOVA
Chi-Square
Correlation
Regression
Control Plan
Kaizen
MTBF and MTTR
Project Pitfalls
Error Proofing
Z Scores
OEE
Takt Time
Line Balancing
Yield Metrics
Sampling Methods
Data Classification
Practice Exam
... and more


