FMEA
Failure Mode and Effects Analysis
Description:
The Failure Mode and Effects Analysis, FMEA, is a subjective screening tool that uses numerical assignments to determine the risk associated with each input (failure mode). The highest scored items add the highest risk to the problem or present the highest risk to the process, design, or function.
Objective:
Assign a level of risk for each input as in impacts the output by determining the severity, frequency of occurrence, and ability to detect the failure mode for each input. A Risk Priority Number (RPN) is calculated, and corrective action emphasis is given to those inputs with the highest RPN. Any input with a high severity (such as 9-10) should be given attention regardless of its RPN.
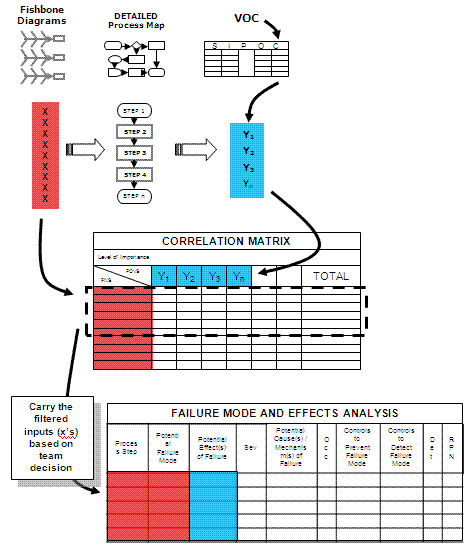
The figure below shows the linkage of the subjective screening tools in a DMAIC project.
FMEA Tutorial
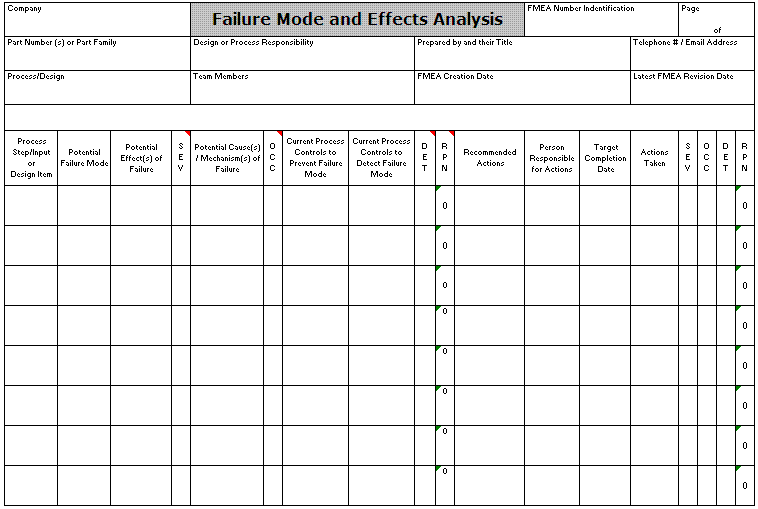
FMEA Template
How to complete a FMEA
Before you and the team jump into assigning values, remind everyone that assigning ratings is subjective. Companies have different interpretations of each value and its meaning. Some companies have developed tables and guides for each number 1-10 on what they represent.
It is more important that the scale applied is linear and well understood by each appraiser to minimize error from interpretation. The appraisers in this application are the team members, each one gets has input. Take time to review the meaning of each value for:
- SEVERITY
- OCCURRENCE
- DETECTION
Each person can explain their score too and this helps the others on the team understand their perspective on the problem. Eventually the team leader needs to decide on one value and move on.... don't let this process drag out too long, keep the team moving forward. It's easy to get derailed and begin long debates. Be mindful of this!
Completing the FMEA:
- List the INPUTS on left side of table from the Correlation Matrix. In some cases, you can start directly with the FMEA and list your failure modes (in other words there may not be a need to use the Correlation Matrix first)
- List each failure mode (or input that is or could contribute to the problem).
- Assign 1-10 for SEVERITY. 1 - not severe and 10 catastrophic, death, shutdown.
- Assign 1-10 for the frequency of OCCURRENCE. 1 – extremely rare, 10 being at every opportunity.
- Assign 1-10 for the capability of DETECTION of the failure mode. 1 being detectable every time, 10 being impossible to detect.
- Multiply the values for SEVERITY, OCCURRENCE, and DETECTION and the becomes the RPN, risk priority number.
SEVERITY * OCCURRENCE * DETECTION = RPN - Sort the RPN’s from highest to lowest and assign corrective and preventive actions to each.
- Assign one person to be responsible for each input that the team decides to improve. The team may choose to try all of them or just a few depending on the magnitude, time allotted for the project, and other factors.
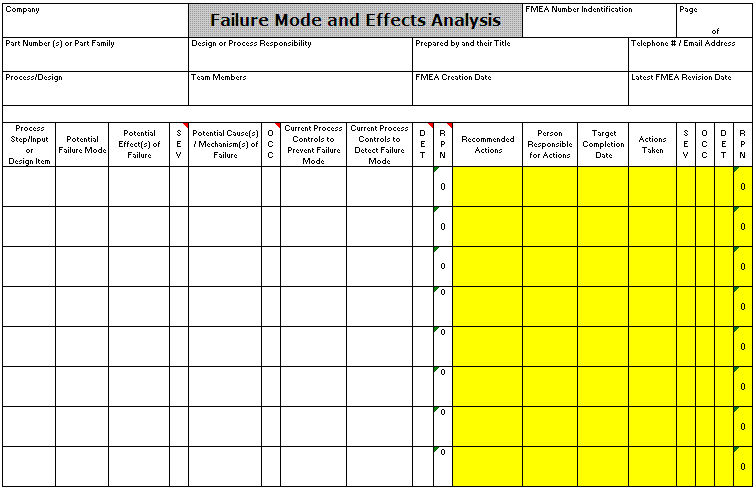
- This activity becomes part of the IMPROVE phase (sometimes it's done in the CONTROL phase). As improvements are completed, revised values are determined by the team and entered on the same original FMEA and this becomes the REVISED FMEA (see the YELLOW portion of the figure below).
Keep in mind, none of the scores can be a zero or the RPN will be zero. Therefore, to make the list on the FMEA as a Failure Mode, there must be a score >0 assigned to each the Severity, Occurrence, and Detection score.
Revised FMEA (used in CONTROL phase)
(complete the yellow highlighted section - use original FMEA)
CLICK HERE to get this FMEA Template
The GOAL of a FMEA
The goal is to reduce the highest
RPN’s. It’s a never-ending cycle and not all of the failure modes have to be
addressed and re-scored at once.
- Sort the Failure Modes in descending order with the highest RPN’s at the top. These are the modes to focus on reducing the Severity, Occurrence, and Detection.
- Complete any easy improvement actions regardless of RPN.
- Target Failure Modes with a high severity value inputs regardless of RPN.
After an improvement is done, rescore the failure mode and continue on the journey of reducing other RPN’s. Often times an improvement can be applied to other failure modes...find all those you can!
This tool is widely used in quality control organizations across
all industries and segments to improve customer satisfaction.
They are used for design, processes, services, and more. It is
recommended to become very familiar with this tool and how it works.
FMEA Template
Click here to purchase the FMEA and REVISED FMEA template.
FMEA Module - Download
|
Click here to get a training module about the FMEA and 1000+ slides to help prepare you as a Green or Black Belt. Also comes with a 180+ question Practice Exam. All Six Sigma project managers need to be familiar with this tool as it applies to almost every project. |
Example Test Questions
What is the Risk Priority Number (RPN) of a particular failure mode where the team assigned the following values?
Severity = 5, Detection = 3, and Occurrence = 9
RPN = Severity * Detection * Occurrence = 5 * 3 * 9 = 135
Next, assume the team implemented a few poka-yokes and other improvements. Therefore, the revised FMEA now has the following scores assigned by the team:
Severity = 5 (usually the severity of the failure mode stays the same but not always)
Detection = 2
Occurrence = 4
What is the RPN for the Revised FMEA? The answer is 5*2*4 = 40
Therefore, the RPN for that failure mode was reduced from 135 to 40. This is obviously a significant improvement but it may not be enough depending on the customer needs.
The idea is to go after the highest RPN on a regular basis. The process never stops in the world of quality control. There will always be a failure mode(s) with a higher score than others. Never stop pursuing the ability to reduce the RPN's.
Think about the three categories.....usually ANY failure mode with a Severity of 5 or higher automatically gets attention. A failure mode with a high severity should be addressed vigorously to somehow reduce the severity, perfect the detection, or eliminate the possibility of it occurring.
FMEA & Revised FMEA Example
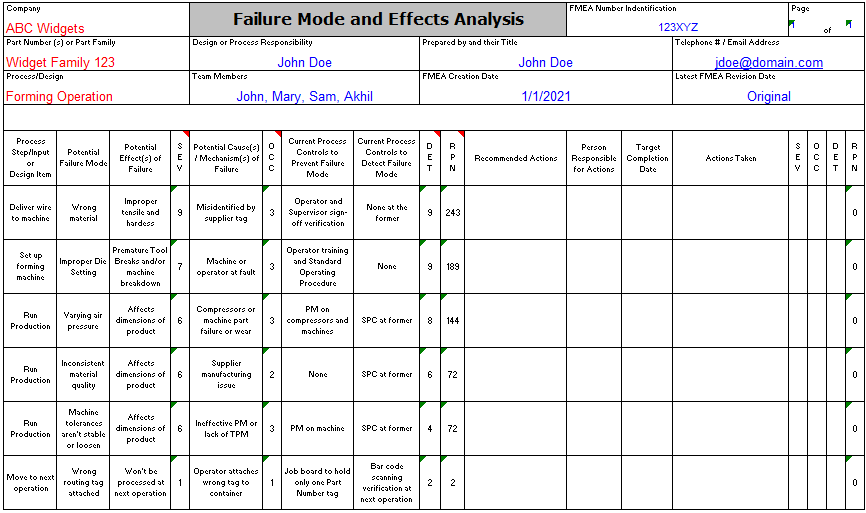
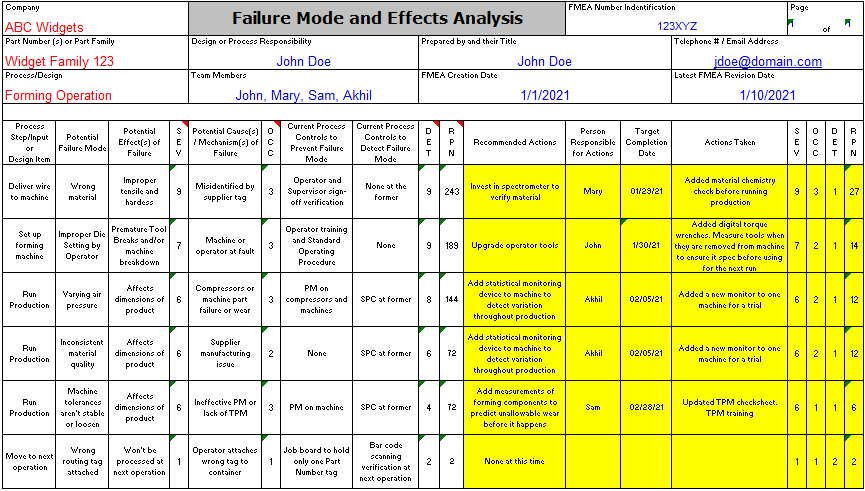
The example below shows a Six Sigma team's initial FMEA for a few process steps involving setting up and forming a widget.
Notice the right side of the FMEA is not yet complete. This portion is completed after the improvements are in place and verified.
You can see the highest RPN is delivering of wire to the machine with a potential failure mode of "Wrong Material".
The RPN is 243 followed by others of lower RPN. The team decides to implement a series of improvements (actions) to address the highest RPN's.
Often times simple improvements such as improving the quality of work instructions (SOP's) and advanced training are common improvements for almost any failure mode. Many improvements apply to more than one failure mode as well.
Some improvements require money, testing, trials, or other resources. Remember you may not be able to do them all but at least get the ideas on paper and discuss them with the leadership of the company.
Below you can see the improvements and the impact of the RPN on the failure modes. All of them were reduced except for one that the team decided not to address.
What is that worth to the company? You will want to quantify those risk reductions with your Finance representative.
Now the cycle continues and the relentless pursuit for improvement never ends.
Ease Of Completion (EOC) Matrix
Sometimes resources are limited and not all the KPIV's can be improved. Or the stakeholders may want to know where to prioritize the improvements.
Although a KPIV may have a high RPN, it may not be very easy, or cost a lot of money, therefore it may not be "Easy" to complete.
A Six Sigma team should try to get some easy wins. What can be done with minimal resources and quickly.
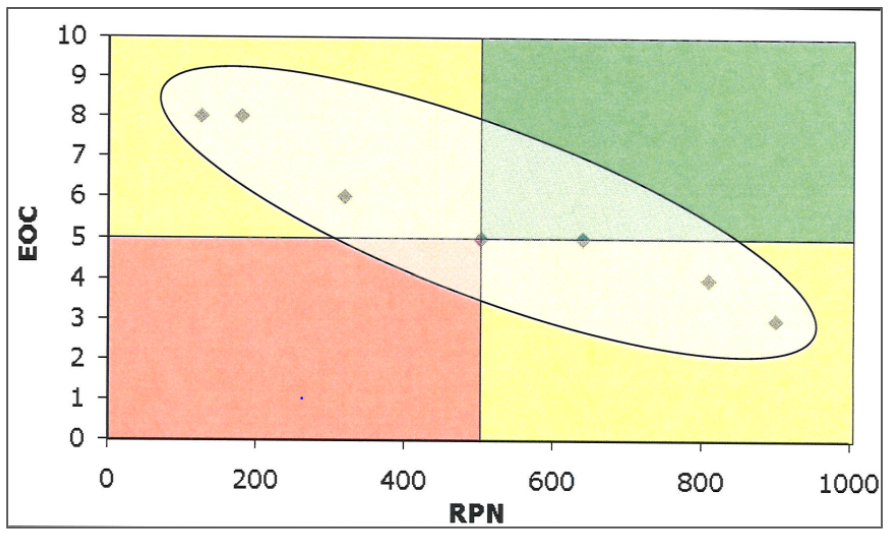
That brings us to this matrix. The team plotted an EOC (Ease of Completion) score for each RPN from the FMEA.
The higher the EOC score, the easier the improvements are to complete for a KPIV.
The RPN values are taken directly from the FMEA (this is just an example below).
- Improvements in the GREEN shaded area have a high RPN and high ECO score so you can get the improvements done rather easy and impact a KPIV with a high RPN.
- Improvements in the YELLOW zones may be easy but impact a lower RPN input. Or impact a high RPN value but not easy to complete.
- Improvements in the RED zone are not easy to complete nor impact an input with a significant RPN.
Initial efforts would be directed to addressing KPIV's in the GREEN zone.
Subscribe for full site access
Project Acceleration Techniques
Return to Six-Sigma-Material Home Page
Recent Articles
-
Process Capability Indices
Oct 18, 21 09:32 AM
Determing the process capability indices, Pp, Ppk, Cp, Cpk, Cpm -
Six Sigma Calculator, Statistics Tables, and Six Sigma Templates
Sep 14, 21 09:19 AM
Six Sigma Calculators, Statistics Tables, and Six Sigma Templates to make your job easier as a Six Sigma Project Manager -
Six Sigma Templates, Statistics Tables, and Six Sigma Calculators
Aug 16, 21 01:25 PM
Six Sigma Templates, Tables, and Calculators. MTBF, MTTR, A3, EOQ, 5S, 5 WHY, DPMO, FMEA, SIPOC, RTY, DMAIC Contract, OEE, Value Stream Map, Pugh Matrix

Site Membership
LEARN MORE
Six Sigma
Templates, Tables & Calculators
Six Sigma Slides
Green Belt Program (1,000+ Slides)
Basic Statistics
Cost of Quality
SPC
Control Charts
Process Mapping
Capability Studies
MSA
SIPOC
Cause & Effect Matrix
FMEA
Multivariate Analysis
Central Limit Theorem
Confidence Intervals
Hypothesis Testing
Normality
T Tests
1-Way ANOVA
Chi-Square
Correlation
Regression
Control Plan
Kaizen
MTBF and MTTR
Project Pitfalls
Error Proofing
Z Scores
OEE
Takt Time
Line Balancing
Yield Metrics
Sampling Methods
Data Classification
Practice Exam
... and more


