|

 content.")

Visual Management
The purpose of visual management is to improve the effectiveness of communication and reaction. This is one component of Lean Manufacturing.
Visual aids can convey messages quicker and invite more interest than written information. And this also means exposing defects and problems to allow them to be addressed sooner....bad news doesn't get better with time.
This is a business management technique employed in many places where information is communicated by using visual signals instead of texts or other written instructions. The goal is allowing quick recognition of the information being communicated, in order to increase efficiency and clarity.
Effective visual management involves careful thought to have the best impact.
OBJECTIVE:
- Expose waste (7-wastes) and make it clear to everyone.
- The work area/cell/machine should "talk" to you in simple terms
- The goals should be clearly indicated
- The status of production should be found with the goals
- Simple problem-solving tools on display (such as A3, 5-WHY)
- Increased communication is ultimately what all the above will do
Don't get carried away...keep it simple:
5S controls can go beyond what is realistic and practical. Other times you'll find 6 lights stacked on a pole and no idea what signal they represent. Some may be blinking and others solid.
This can be too much for workers and management to understand. Or there may be complex statistics displayed that only the Six Sigma manager is familiar with, and the operator and supervisors will not understand.
Below are some examples of visual management, some simpler than others and we use them in our everyday lives.
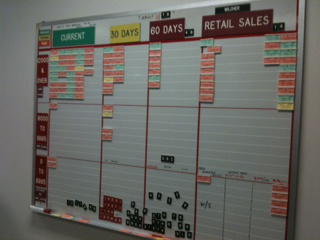
Boards in the Wokplace
 |
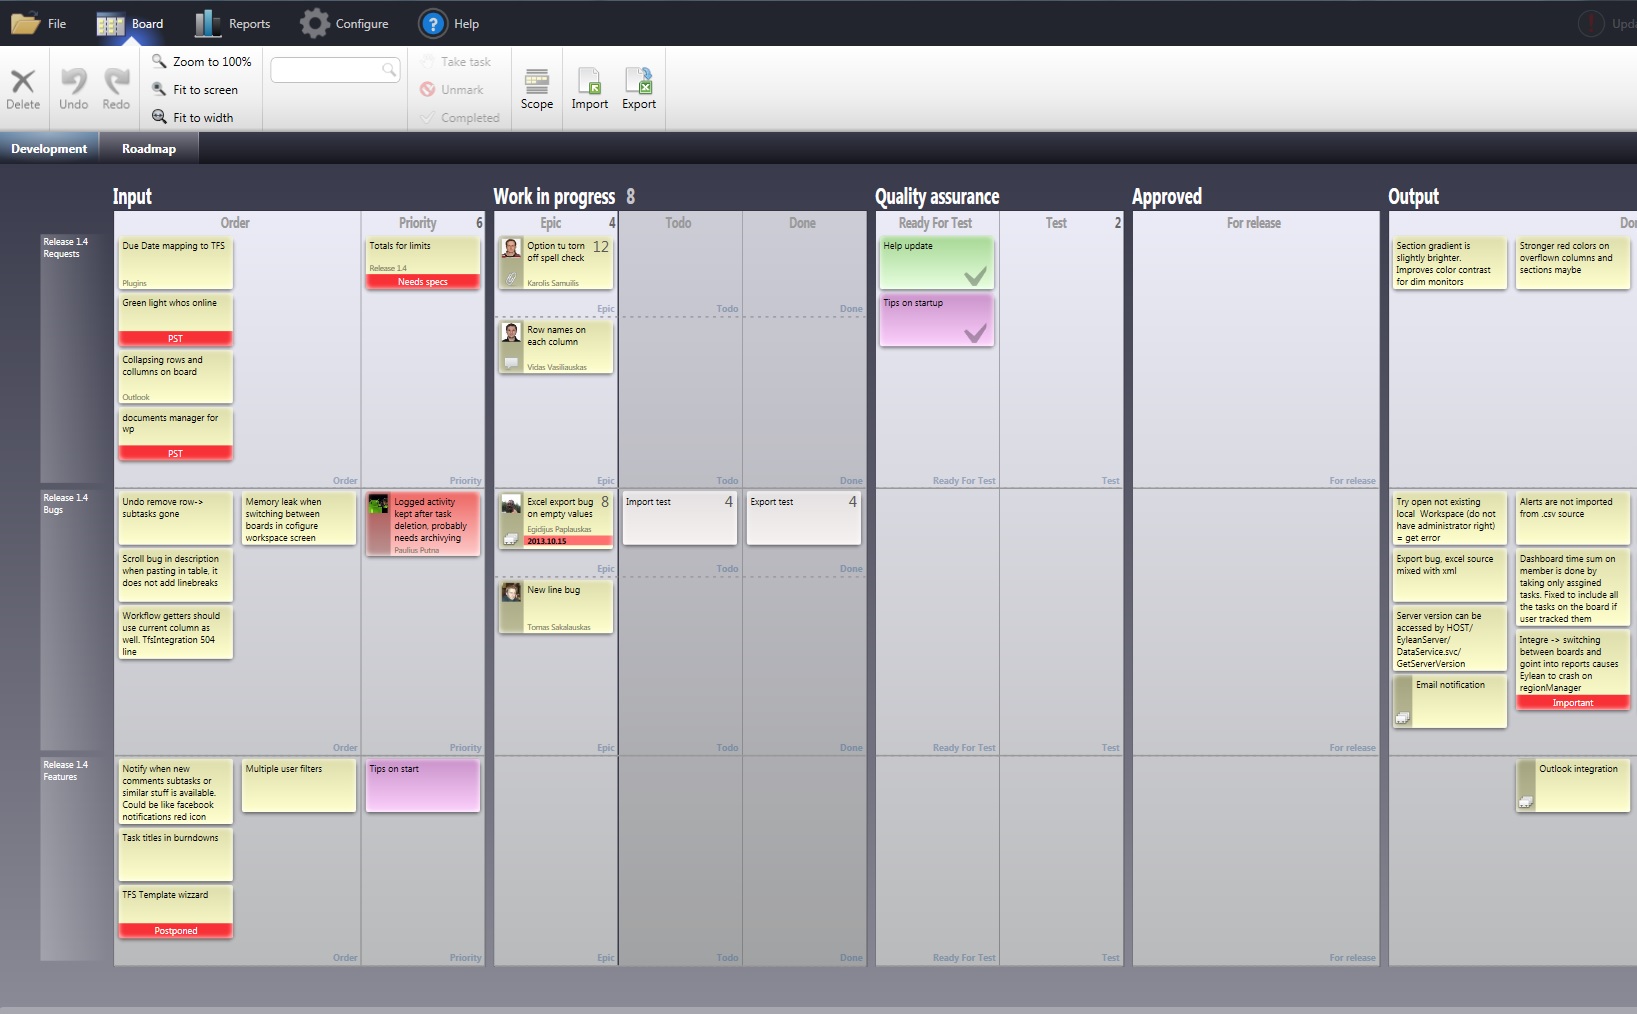 |
As the saying goes..."A picture is worth a thousand words".
Some other common types of Visual Management in the workplace:
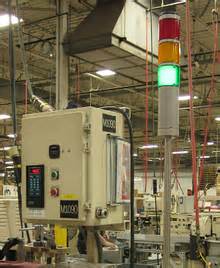
- And/On lights
- Stock Controls and Signals
- Cross-Training Matrix for Employees
- 5S (signs, tape, labels, color coding, etc)
- Control Plans
- Production / Quality / Delivery / Service Metrics
- Glass Wall Metrics
- FMEA's
- Auditing Boards
- Spare Parts Availability (flow racks)
- Standard Operating Procedures or Standard Work
- SPC on production floor
- Preventive Maintenance Boards
- Shadow Boards
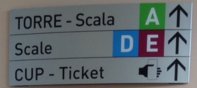
With an understanding that some people are color blind it still doesn't hurt to use colors, or flashing, and universally recognized symbols where possible (such as a red cross). These examples below are more effective with their use of color and symbols.
 |
 |
Flow Racks
Flow racks have several positive features. They can function as a visual signal for Kanban min/max levels, offer first-in, first-out flow, and allow stock to be visual to the operator or consumer...and of course the use of free gravity.
Consider flow racks in Workcells or assembly operations and with a tugger route that replenishes the rack on a JIT basis based minimum Kanban levels.
 |
 |
Standard Operating Procedures
Visual aids should be used whenever possible when creating Standard Operating Procedures and Work Instructions (or Job Aids). Show actual pictures of the board and work area when possible and avoid cartoon-ish pictures to get the most effective communication.
Complex tasks that need a lot of explanation are helpful when explained with pictures, tables, or charts to simplify the intention. Break up all the verbiage with easier to read sections that have visual aids.
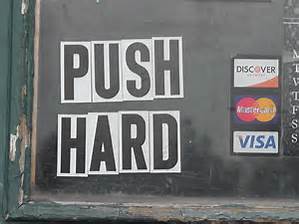
Some tasks (may seem simple) are difficult to explain in words. Take the example of tying a shoe, bowtie, or creating a square knot. Most of us could agree that pictures or a video are more effective means of illustrating this task.
Visual aids are also useful to maintain minimal measurement system variation. Showing pictures of acceptable and non-acceptable parts or having samples for operators or users is another great option of visual aid, and moreover, if the sense of feel or smell is involved in making a correct assessment.
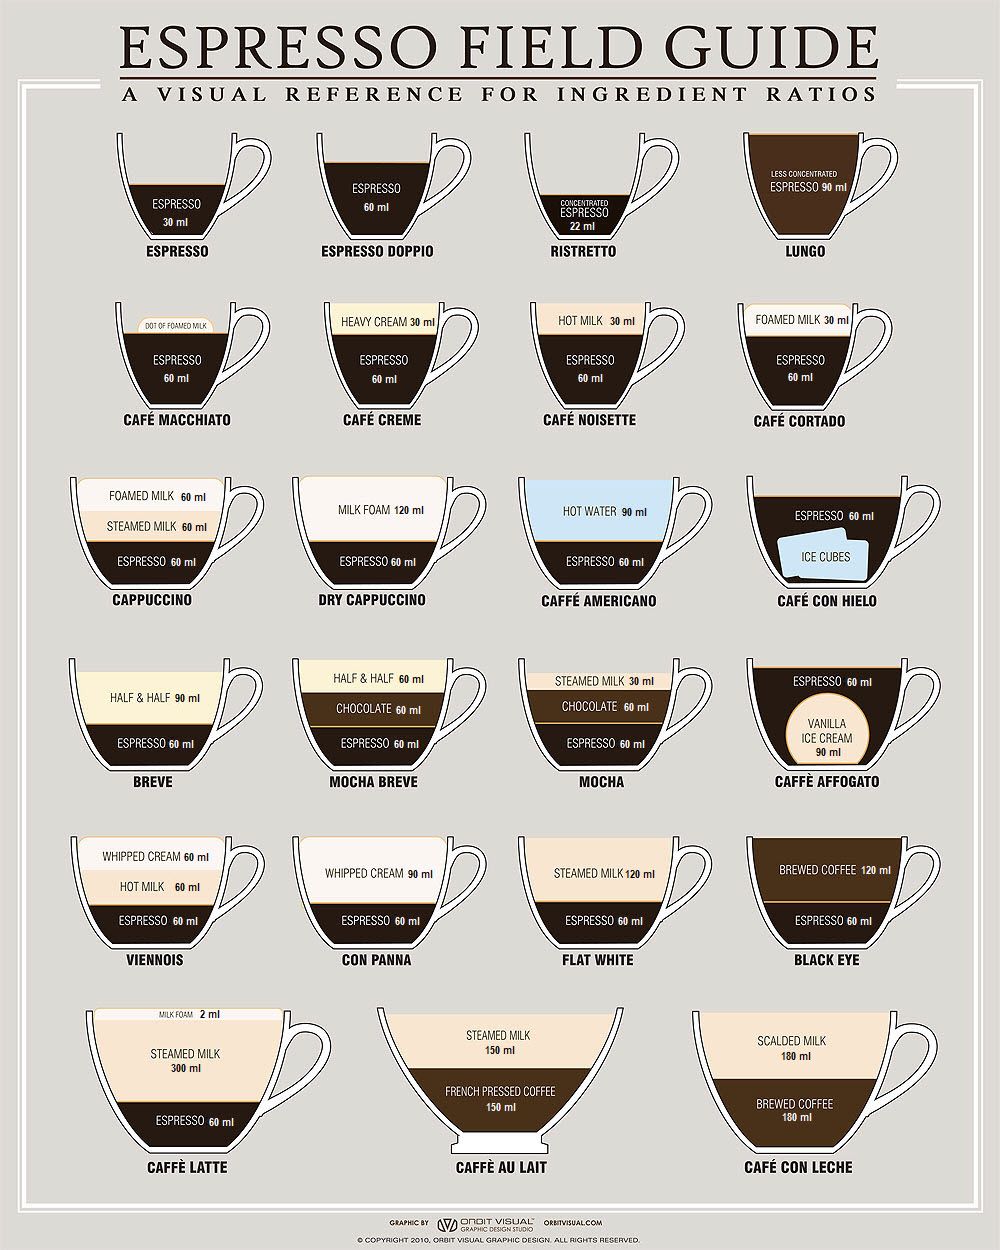
Below are a couple examples where a visual aid makes the task easier than simply a written instruction. Visual Aids are often more appealing to an audience (such as charts and graphs) than a bunch of words.
Take a look at the Espresso visual aid on the right. A potential customer is more likely to examine and understand this than if it were just a bunch of words explaining each type.
 |
 |
 |
 |
Templates, Tables, and Calculators
Project Acceleration Techniques
Return to the Six-Sigma-Material page
Recent Articles
-
Process Capability Indices
Oct 18, 21 09:32 AM
 Determing the process capability indices, Pp, Ppk, Cp, Cpk, Cpm
 -
Six Sigma Calculator, Statistics Tables, and Six Sigma Templates
Sep 14, 21 09:19 AM
 Six Sigma Calculators, Statistics Tables, and Six Sigma Templates to make your job easier as a Six Sigma Project Manager
 -
Six Sigma Templates, Statistics Tables, and Six Sigma Calculators
Aug 16, 21 01:25 PM
Six Sigma Templates, Tables, and Calculators. MTBF, MTTR, A3, EOQ, 5S, 5 WHY, DPMO, FMEA, SIPOC, RTY, DMAIC Contract, OEE, Value Stream Map, Pugh Matrix
Recent Articles
-
Process Capability Indices
Oct 18, 21 09:32 AM
Determing the process capability indices, Pp, Ppk, Cp, Cpk, Cpm -
Six Sigma Calculator, Statistics Tables, and Six Sigma Templates
Sep 14, 21 09:19 AM
Six Sigma Calculators, Statistics Tables, and Six Sigma Templates to make your job easier as a Six Sigma Project Manager -
Six Sigma Templates, Statistics Tables, and Six Sigma Calculators
Aug 16, 21 01:25 PM
Six Sigma Templates, Tables, and Calculators. MTBF, MTTR, A3, EOQ, 5S, 5 WHY, DPMO, FMEA, SIPOC, RTY, DMAIC Contract, OEE, Value Stream Map, Pugh Matrix -
Six Sigma, Six Sigma Training, Courses, Calculators, Certification
Aug 15, 21 10:27 PM
 One site with the most common Six Sigma material, videos, examples, calculators, courses, and certification.

Site Membership
LEARN MORE
Six Sigma
Templates, Tables & Calculators
Six Sigma Slides
Green Belt Program (1,000+ Slides)
Basic Statistics
Cost of Quality
SPC
Control Charts
Process Mapping
Capability Studies
MSA
SIPOC
Cause & Effect Matrix
FMEA
Multivariate Analysis
Central Limit Theorem
Confidence Intervals
Hypothesis Testing
Normality
T Tests
1-Way ANOVA
Chi-Square
Correlation
Regression
Control Plan
Kaizen
MTBF and MTTR
Project Pitfalls
Error Proofing
Z Scores
OEE
Takt Time
Line Balancing
Yield Metrics
Sampling Methods
Data Classification
Practice Exam
... and more