|

 content.")

Baseline Measurement
Description:
A Baseline Measurement is needed to determine the
exact starting point for each project contract primary (Y) and secondary
metrics (y's). These are usually referred to as the "Before" measurement. The final project measurement is called the "After" measurement.
Objective:
The primary metric of interest
(to improve) is the output, Y. The baseline measurement (or beginning performance) is necessary to determine the progress of the
team. Going through his
process from the most recent data collection and sampling may generate a
value different from that shown originally on the project contract.
At
this point, if the difference is significant, the Champion, Sponsor,
and management may need to revise the contract and the financials.
What is a DEFECT?
A defect is characteristic, opportunity, or feature that is non-conforming. Each unit or piece being appraised may have multiple defects.
To
distinguish the spectrum of defect types among units write clear
instructions, use visual aids, and/or add numerical specifications.
Definitions
of defects should be known and held consistent throughout the project.
If it is found that new instructions and aids are necessary then these
should be shared (such as in a SOP or Work Instruction) with all
operators and employees affected so appraisals are reproducible among
everyone.
A Poisson comparison is used for before and after metrics when counting defects per unit since there may be more than one defect per unit that creates a defective unit.
What is a "DEFECTIVE" (or NON DEFECTIVE)?
A piece or unit that is non-conforming or does not meet the customer specification. A defective part or unit may have one or more defects.
A part can be either one of two outcomes: Defective or Not Defective
When there are two outcomes and equal chance each time, this follows the Binomial Distribution
If
there are 80 critical characteristics on a part, then one part can have
up to 80 defects. Whether the part has 1 or 80 defects, it is
considered one defective part.
Numerical statistics are used as
baseline measurements, examples are shown below and calculations can be
found at Basic Statistics
- Z-Score or Benchmark Z-Score
- PPM (see below)
- DPMO
- Cpk
- Cp
- Ppk
- Pp
- Cpm
- Throughput Yield (First Pass Yield)
- Rolled Throughput Yield (RTY)
- Final Yield (FY)
- Normalized Yield (NY)
DPMO vs PPM
DPMO is not the same as PPM since it is possible that each unit
(part or item) being appraised may have multiple defects of the same
type or may have multiple types of defects. A part is defective if it
has one or more defects. The number of Defectives can never exceed the number of Defects.
If each part only has one characteristic that can be a defect, then DPMO and PPM will be the same.
DPMO will always exceed or equal PPM for a given yield (sigma level) performance.
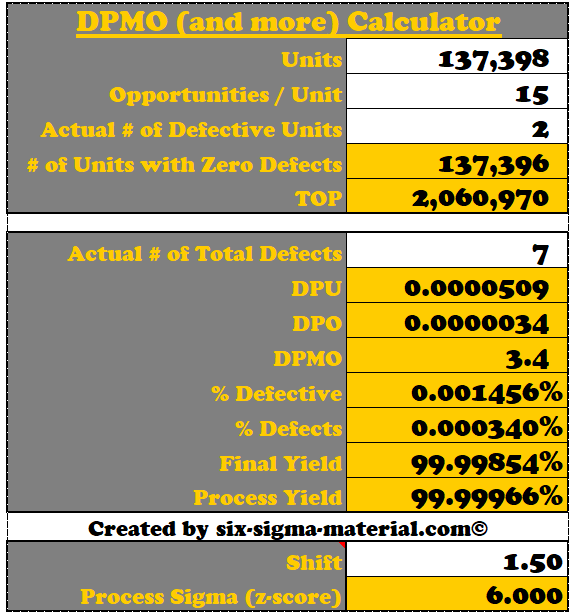
See our DPMO and z-score calculator to help you understand these various terms of DPU, TOP, DPMO, Process Sigma, % Defective, etc.
Process Capability Flowchart for Continuous data
Assessing continuous data is preferred over attribute data. When possible convert to variable data as it provides more information. Follow the flowchart shown below to determine process capability when analyzing continuous data.

 |
Before and After Capability Roadmap This download is available to members |
Return to Process Capability Indices
Return to the Six-Sigma-Material Home Page
Recent Articles
-
Process Capability Indices
Oct 18, 21 09:32 AM
 Determing the process capability indices, Pp, Ppk, Cp, Cpk, Cpm
 -
Six Sigma Calculator, Statistics Tables, and Six Sigma Templates
Sep 14, 21 09:19 AM
 Six Sigma Calculators, Statistics Tables, and Six Sigma Templates to make your job easier as a Six Sigma Project Manager
 -
Six Sigma Templates, Statistics Tables, and Six Sigma Calculators
Aug 16, 21 01:25 PM
Six Sigma Templates, Tables, and Calculators. MTBF, MTTR, A3, EOQ, 5S, 5 WHY, DPMO, FMEA, SIPOC, RTY, DMAIC Contract, OEE, Value Stream Map, Pugh Matrix -
Six Sigma, Six Sigma Training, Courses, Calculators, Certification
Aug 15, 21 10:27 PM
 One site with the most common Six Sigma material, videos, examples, calculators, courses, and certification.

Site Membership
LEARN MORE
Six Sigma
Templates, Tables & Calculators
Six Sigma Slides
Green Belt Program (1,000+ Slides)
Basic Statistics
Cost of Quality
SPC
Control Charts
Process Mapping
Capability Studies
MSA
SIPOC
Cause & Effect Matrix
FMEA
Multivariate Analysis
Central Limit Theorem
Confidence Intervals
Hypothesis Testing
Normality
T Tests
1-Way ANOVA
Chi-Square
Correlation
Regression
Control Plan
Kaizen
MTBF and MTTR
Project Pitfalls
Error Proofing
Z Scores
OEE
Takt Time
Line Balancing
Yield Metrics
Sampling Methods
Data Classification
Practice Exam
... and more