|

 content.")
Confidence Interval
Objective:
This section will explain the meaning of the Confidence Interval (CI) in statistical analysis. The calculations will be shown for the:
- Mean
- Standard Deviation
- Proportion
This site assumes that for means and standard deviation the sample data comes from a normal distribution. For proportions, the normal distribution approximates the binomial for n x P(hat) is greater than or equal to 5.
Most common confidence interval selections are 90%, 95%, or 99% but are dependent on the voice of the customer, your company, project, and other factors.
Sample statistics such as the mean, standard deviation and proportion (x-bar, s, p-bar) are only estimates of the population parameters.
Confidence Intervals are used to quantify the uncertainty by providing a lower limit and upper limit that represent a range of values that will represent the true population parameter with a specified level of confidence.
Confidence intervals are a form of statistical estimate. A point estimate is just a single number whereas a confidence interval is a form of statistical estimate that is a range that is estimated to include the parameter being estimated with a specified probability.
Selecting a 99% CI suggests that approximately 99 out of 100 CI's will contain the population parameter. A 0.99 confidence interval states that there is 99% probability that the interval contains the population parameter, and that there is a 1.0% risk that the population parameter is not contained within the interval.
Confidence Level = 1 - alpha risk
(1 - alpha-risk) is called the probability content or level of confidence.
Alpha-risk is known as the significance level; the probability of being making an incorrect decision, in other words, being wrong.
What the difference between a Confidence Level and Confidence Interval?
Confidence level refers to the percentage of probability, or certainty, that the confidence interval would contain the true population parameter when you draw a random sample repeatedly.
Often results are shown for a “95% Confidence Interval” …. this means there is a 95% confidence level that the confidence interval contains the population parameter and 5% risk (alpha) of the CI not containing the population parameter.
A specified value of the CI signifies that probability of the interval containing the population parameter, and that there is an alpha-risk (1-CI) that the population parameter is not contained within the interval.
CI's are applied in statistical test for means, standard deviations, proportions, capability indices, regression analysis, and upper/lower control limits on control charts.
In regression analysis, the CI is based on a provided value of X for a given level of confidence. This CI is likely to contain the true best fit line.
There are three factors that impact the confidence interval:
- Sample size
- Population size
- Percentage
1) Sample Size
CI's are used when you are unable to capture and analyze an entire population (census) and the sample (statistics) to infer statements about a population. The larger your sample size, the more confidence one can be that their answers represent the population.
Though the relationships are not linear, the larger the sample size the smaller the confidence interval (in other words, the more confident you can be that it the true population parameters will fall within a tighter spectrum or tighter distribution).
2) Population Size
The size of the population is a factor when working with a relatively small and known group of data (such as the number of pieces of candy in a bag versus the number of fish in the ocean).
The CI calculations assume you have a true random sample of the population. If the sample is not, then one cannot rely on the confidence intervals calculated because you can no longer rely on the measures of central tendency and dispersion.
Sampling plans are an important step to ensure the data taken within is reflective and meaningful to represent the population. Click here for information regarding sampling plans.
3) Percentage
The accuracy of the CI also depends on the percentage of your sample that picks a particular answer. If 99.9% of the parts sampled PASSED and the 0.1% FAILED, the chances of error are very low regardless of sample size.
However, if the percentages are 51% and 49% the chances of error are much greater. It is easier to be sure of extreme answers than those aren't, thus the interval is not linear.
Point Estimate
Let's go over jargon used within this topic. You'll see a lot of terms used when learning about confidence intervals, risks, samples, populations, and the following tries to connect all the dots and show you how these terms are related.
A point estimate is:
- a specific number
- a sample statistic
- unbiased estimator or population parameter
The sample standard deviation (s) is an unbiased estimator of σ
The sample variance (s2) is an unbiased estimator of σ2
The sample mean (x-bar) is an unbiased estimator of μ
The sample proportion (p-hat) is an unbiased estimator of P
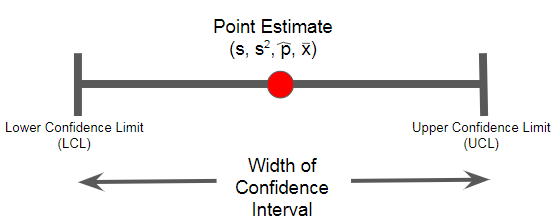
The Confidence Interval is an interval estimate that provides more information than just a specific number like the Point Estimate.
The Confidence Interval provides information of variability around a point estimate. You can never be 100% confident when using a sample from a population.
If using a 95% CI, this is saying that from repeated samples from the same population, 95% of all the confidence levels that can be generated will contain the true population parameter.
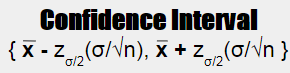
CI = POINT ESTIMATE +/- (Reliability Factor) (Standard Error)
The Reliability Factor depends on your chosen Confidence Level (or alpha risk)
Confidence Interval for the MEAN
Assuming the population distribution is normal, or you have a very large sample size of a non-normal distribution and:
- If the population standard deviation IS known, use the Z-distribution table.
- If the population standard deviation IS NOT known, use the t-distribution table.
As the t-distribution sample size increases it behaves like z-distribution and t-value approaches 0. For a given level of confidence, the t-distribution becomes a flatter "bell" curve with the t-statistic increasing as the sample size decreases.
The CI for the mean for the following two examples:
= sample mean +/- (confidence factor) (measure of variability)
which is another way of saying the CI
= point estimate +/- (reliability factor) (standard error)
Confidence Interval MEAN with KNOWN σ
EXAMPLE:
A sampling of 22 patients in the emergency room showed they waited on average 45 minutes. From the past data we know that the population standard deviation is 5.8 minutes.
Estimate the 99% confidence interval for the average wait time of the patients. Assume population is normally distributed.
Given:
n = 22
sample mean = 45 minutes = x-bar
population standard deviation = 5.8 minutes = σ
Alpha-risk = 1-CI = 1-0.99 = 0.01 = 1%
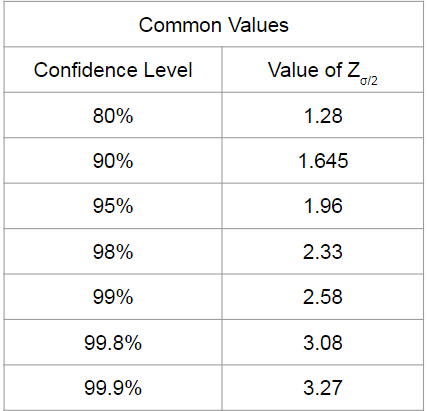
The critical z-value is 2.58 for 99% desired confidence level.
Find the Confidence Interval:
CI = 45 +/- 2.58 (5.8 / √22) = 45 +/- 2.58(5.8/4.69) = 45 +/- 3.19 = {41.81, 48.19}
What does this tell us?
This Confidence Interval (CI) has a lower bound of 41.81 minutes and upper bound of 48.19 minutes. CI's are often used to project future results.
Interpretation
With 99% confidence it can be estimated that the true population mean for the wait time is between 41.81 minutes and 48.19 minutes.
Explanation of 99% Confidence Level
99% of all confidence intervals constructed in this way contain the true mean statistics wait time. For example, if 100 of these confidence intervals were constructed (from 100 normal random samples) we would expect 99 of them to contain the true population mean wait time.
Although it's possible the true mean may not be within these values, 99% of the confidence intervals generated in the manner will contain the true mean.
FYI: With only 95% CL (taking more risk), you can say that the true population mean is between 42.58 minutes and 47.42 minutes. You would substitute a z-value of 1.96 instead of 2.58 in the above formula.
Confidence Interval MEAN with UNKNOWN σ
EXAMPLE:
A sampling of 17 patients in the emergency room showed they waited on average 45 minutes with a standard deviation of 5.8 minutes. Estimate the 99% confidence interval for the average wait time of the patients. Assume population is normally distributed and the population standard deviation is not known.
Given:
n = 22
sample mean = 45 minutes = x-bar
sample standard deviation = 5.8 minutes
Degrees of freedom (dF) = n-1 = 21
Alpha risk = 1-CI = 1- ∝ = 1-0.99 = 0.01 = 1%
The critical t-value from the table using two tailed is 2.831
Remember to take the ∝/2 when using the t-table.

What does this tell us?
This is telling us that the point
estimate of the average wait time is 45 minutes with an error of +/- 5.8
minutes. There is 99% certainty that the interval {41.5 minutes to 48.5
minutes} contains the true process mean. There is a 1% chance that this
decision is wrong.
What would happen to the width of the CI if you selected to use only a level of 90%?
Think
about what is occurring. You are willing to accept a much lower level
of confidence that the interval will contain the true population mean (the
actual waiting time of all patients coming into the emergency room), so
you can tighten the range of values.
If you want to nearly guarantee that your interval contains the true population mean, then you
would want to include every value in the interval, so the interval spreads as
the level of confidence desired increases.
The only value that changes is the critical t-value, it is now 1.721, and the CI is now {42.87,47.12}.
As
CI increases, the interval spreads. As sample size increases, the
interval narrows (more representative of the entire population).
Excel - Confidence Interval for MEAN
You can use Excel to
find only the CI for a population mean. The population standard
deviation must be known. You must determine the sample mean (x-bar) for the result to make sense and using 95% confidence level.
Suppose you have the following data:
Alpha risk = Level of Significance = 1 - Confidence Level = 0.05 = 5%
Population Standard Deviation = 6.48
Sample Size = 27 = n
Sample Mean (x-bar) = 50
The data would be entered in as shown and the result is 2.44 as shown in cell A1.
Newer versions now use CONFIDENCE.NORM for z-distributions and CONFIDENCE.T for t-distributions.

Knowing that you determined your sample mean (x-bar) to be 50, add 2.44
to get the upper limit of the interval and subtract 2.44 to get the
lower limit of the interval and that becomes the CI for the population
mean.
The interval is 50 +/- 2.44, or 47.56 to 52.44
Confidence Interval for the STANDARD DEVIATION
The chi-squared distribution is not symmetrical and each varies according to the degrees of freedom, dF.
The degrees of freedom equals n-1, dF = n-1.
This
technique lacks robustness, in that it is very important that the
population is known to be normally distributed when using it to estimate
the population variance or standard deviation.
EXAMPLE:
Twenty-five
assembly line workers throughout the Southwest United States were found to have a
standard deviation in their total compensation of $2.43. The average
total compensation of an assembly line worker in the that was published
by Bureau of Labor and Statistics was $38.73 for a similar worker in the
Southwest.
Calculate the population standard deviation using a 95%
confidence level. Assume the population is known to be normally
distributed.
Sample standard deviation = $2.43
The average wage of $38.73 is not needed for the CI calculation.
n = 25
dF = n-1 = 24

Confidence Interval for PROPORTIONS
Many business decisions
involve population proportions such as estimating market share and
proportions of goods that are acceptable or defective.
EXAMPLE:
A
survey was conducted on 300 emerging, domestic, small capital companies
and found that 153 had an Emergency Action Plan that detailed reaction
plans to maintain operations and customer service in the event of major
illness or outbreak such as the swine flu.
Calculate the 92%
confidence interval to estimate the proportion of emerging domestic,
small capital companies that have an adequate Emergency Action Plan.
n = 300
p-hat = 153/300 = 51% = 0.51
The critical Z(0.04) value = 1.75
NOTE:
The "approximate" method is shown in the calculation below which uses the z-distribution. The exact method uses the F-distribution and that formula is shown further down this web page.

The CI states that with 92% confidence, the proportion of all similar companies with the plan is estimated to be between 46% and 56%.
Confidence Interval for CAPABILITY
To determine the CI for process capability use the formula provided below where:
USL = customer upper specification limit
LSL = customer lower specification limit
Pp is a process index that numerically describes the long-term capability.
Cp is the short term indicator, Cp should always be analyzed with Cpk, as Pp should always be analyzed with Ppk.
Both
Cp and Pp are a function of the process standard deviation, not a
nominal (target) value that may be historical or provided by the
customer.

Confidence Interval Download
 |
Click here to purchase 1000+ Six Sigma training slides that offer more information regarding confidence intervals. Often, statistics are not expressed in terms of one number but rather as a range or an interval with a given level of confidence. |
Confidence Interval Roadmap


Asymmetric Confidence Interval
An asymmetric confidence interval is one where the point estimate isn't the center of the confidence interval. For example, the point estimate may be 0.2 but the confidence interval is {0,0.8} because it happens to be that the values cannot be less than zero.
There are a few reasons a confidence interval could be asymmetric:
- Random error is included
- The data has been transformed
- Positive or negative systemic bias incorporated
Confidence INTERVAL vs. Confidence LEVEL
What the difference between a Confidence Level and Confidence Interval?
Confidence Level refers to the percentage of probability, or certainty, that the Confidence Interval would contain the true population parameter when you draw a random sample repeatedly.
Often results are shown for a “95% Confidence Interval” …. this means there is a 95% Confidence Level that the Confidence Interval contains the population parameter and 5% risk (alpha) of the Confidence Interval not containing the population parameter.

Relationship with Margin of Error (ME)
The Margin of Error is a component of the CI calculation - see the visual aid below. Click here to review the entire module on the topic of Margin of Error.

Search Six Sigma related job openings
Templates, Tables, and Calculators
Recent Articles
-
Process Capability Indices
Oct 18, 21 09:32 AM
 Determing the process capability indices, Pp, Ppk, Cp, Cpk, Cpm
 -
Six Sigma Calculator, Statistics Tables, and Six Sigma Templates
Sep 14, 21 09:19 AM
 Six Sigma Calculators, Statistics Tables, and Six Sigma Templates to make your job easier as a Six Sigma Project Manager
 -
Six Sigma Templates, Statistics Tables, and Six Sigma Calculators
Aug 16, 21 01:25 PM
Six Sigma Templates, Tables, and Calculators. MTBF, MTTR, A3, EOQ, 5S, 5 WHY, DPMO, FMEA, SIPOC, RTY, DMAIC Contract, OEE, Value Stream Map, Pugh Matrix -
Six Sigma, Six Sigma Training, Courses, Calculators, Certification
Aug 15, 21 10:27 PM
 One site with the most common Six Sigma material, videos, examples, calculators, courses, and certification.

Site Membership
LEARN MORE
Six Sigma
Templates, Tables & Calculators
Six Sigma Slides
Green Belt Program (1,000+ Slides)
Basic Statistics
Cost of Quality
SPC
Control Charts
Process Mapping
Capability Studies
MSA
SIPOC
Cause & Effect Matrix
FMEA
Multivariate Analysis
Central Limit Theorem
Confidence Intervals
Hypothesis Testing
Normality
T Tests
1-Way ANOVA
Chi-Square
Correlation
Regression
Control Plan
Kaizen
MTBF and MTTR
Project Pitfalls
Error Proofing
Z Scores
OEE
Takt Time
Line Balancing
Yield Metrics
Sampling Methods
Data Classification
Practice Exam
... and more