|

 content.")
Hypothesis Testing
Hypothesis testing is the testing of a claim or a premise. This process requires selecting the correct hypothesis test...which can be tricky in itself.
In hypothesis testing, samples are most often taken to represent a subset of the population since the entire population can rarely be studied. From these samples, hypothesis testing used to infer conclusions about the population.
There's always a chance or risk (known as alpha-risk and beta-risk) that the selected sample is not representative of the population, and one could infer the incorrect conclusion.
Assumptions are inferred, that allow the estimation of the probability (known as p-value) of getting a wrong conclusion. Statistical software has simplified the work to the point where comprehension of these tests is convenient to overlook.
CAUTION: A statistical difference doesn't always imply a practical difference; numbers don't always reflect reality.
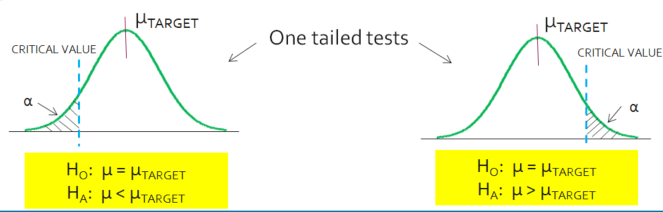
To start a hypothesis test, develop the null (HO) and alternative hypotheses (HA). The alternative hypotheses may be one-sided or two-sided.
A one-sided test is used if you only want to detect positive differences or only negative differences from the null hypotheses.
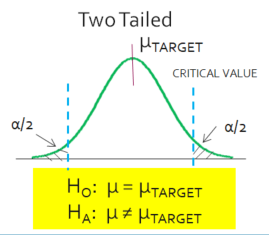
A two-sided test is used if you want to detect any difference from null, positive or negative.
Parametric Tests are used when:
- Normally distributed data
- Non-normal distribution but transformable
- Sample size is large enough to satisfy the Central Limit Theorem
- Require that the data be interval or ratio data
Nonparametric tests are used when:
- The above criteria are not met or if distribution is unknown
- These tests are used when analyzing nominal or ordinal data
- Nonparametric test can also analyze interval or ratio data
In general, the power of standard parametric tests is greater than the power of the alternative nonparametric test. As the sample size increases and becomes very large the power of the nonparametric test approaches its parametric alternative.
Nonparametric tests also assume that the underlying distributions are symmetric but not necessarily normal. The assumption is these test statistics are "distribution-free. In other words, there aren't any assumptions made about the population parameters.
When the choice exists on whether to use the parametric or nonparametric, if the distribution is fairly symmetric, the standard parametric tests are better choices than the nonparametric alternatives.
A few nonparametric tests are Spearman rank correlation coefficient, Mann-Whitney U, Sign, Wilcoxon rank sum, Levene's, and Kruskal-Wallis H.
Comparison of Means (Parametric Tests)

Comparison of Means
Z-test / One Sample t-test / Two Sample t-test / Paired t-test
Comparison of Variances
For 1 sample: Chi-square
For 2 samples: F-Test or ANOVA for >2 variances. The F-test assumes the data is normal.
Levene's test is an option to compare variances of nonparametric data.
For >2 samples: Use Bartlett's Test for parametric data and Levene's Test for nonparametric data
Comparison of Proportions
For 1 sample: One Proportion Test
For 2 samples: Two Proportion Test
For >2 samples: Chi square
Do I choose a Means or Proportions Test?
A test for Proportions is used when each observation can only be conforming (not defective) or nonconforming (defective). Each response is one of those two options.
A test for Means is used when each observation could have >2 values and potentially infinite values (if going to extreme decimals) within a range of values.
Hypothesis Testing Steps
- Define the Problem
- State the Objectives
- Establish the Hypothesis (left-tailed, right-tailed, or two tailed test).
- State the Null Hypothesis (HO)
- State the Alternative Hypothesis (HA)
- Select the appropriate statistical test
- State the alpha-risk (α) level
- State the beta-risk (β) level
- Establish the Effect Size
- Create Sampling Plan, determine sample size
- Gather samples
- Collect and record data
- Calculate the test statistic
- Determine the p-value
If p-value < α, reject HO and accept HA
If p-value > α, fail to reject the Null, HO
Try to re-run the test (if practical) to further confirm results. The next step is to take the statistical results and translate it to a practical solution.
It is also possible to determine the critical value of the test and use to calculated test statistic to determine the results. Either way, using the p-value approach or critical value should provide the same result.
Create a Visual Aid of the Test
To simplify the testing process, break down the process into 4 small steps.
Create a table similar to the one below and begin by completing the top two quadrants. The bottom-left contains the results from the test and then converting those numbers into meaning is the practical result which belongs in the bottom-right quadrant.

Hypothesis Testing Jargon
Statistical Power
The statistical power is 1 - β. Usually β is between 10-20%; therefore, the Power typically is 80-90%.
This is the likelihood of finding an effect when there is actually an effect. This is the chance of rejecting the null hypothesis when the null hypothesis is actually false.
Detectable Difference (δ)
A minimum detectable difference, δ, can also be specified. This detectable difference is used to examine a desired difference among:
- Target (or given) value and a sample mean - using 1 sample t test
- Two sample means - using Paired t or 2 sample t tests
- > 2 sample means in ANOVA
- Target (or given) value and a sample proportion
- Two proportions
Sensitivity
The minimum detectable difference desired relative to the standard deviation is the sensitivity of the test. It is the size of the difference expressed in standard deviations.
Similar to the Coefficient of Variation in that the mean is expressed as relative magnitude in standard deviations. The numerator itself doesn't provide much information, it is when it (or the δ) are expressed in terms of standard deviations are you able to compare two or more values with more meaning.

What is a Test Statistic?
The test statistic is a value (z, t, F, etc.) from the sample, or observed, data from the actual experiment (not the area under a curve).
It has a relationship to probability of occurrence that will be the p-value. A measure of how far x (observed) is from the hypothesized value of μ.
It has a relationship to the p-value. The p-value represents the area under the curve (below and/or above) the test statistic value.
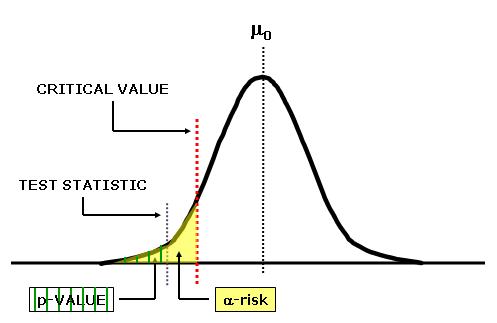
In the picture above, the test statistic is less than the critical value AND the area under the curve is < area under the alpha-risk value.
If the alpha-risk was chosen to be 0.05 that means 5% of the area of the total curve is under the critical value in this one-tailed picture above (not to scale).
5% of the area is in the one rejection region (since this is one-tailed depiction). 95% of the area under the curve is in the "failed-to-reject" region.
In this case the p-value will be <0.05 (< 5% of total are under the curve) and thus reject the null hypothesis and infer the new mean is less than the original mean.
What is a Critical Value?
Click here to visit a page explaining Critical Values.
Null Hypothesis & Alternative Hypothesis
Null Hypothesis characteristics:
- Denoted as "HO"
- Assumed to be true until proven otherwise
- Represents "no difference" or "no change"
- Factor is not statistically significant
- Population follows (or can be assumed) a normal distribution
- Variation is from random, inherent sources.
This is the hypothesis being tested or the claim being tested. The null hypothesis is either "rejected" or "failed to reject". Rejecting the null hypothesis means accepting the alternative hypothesis.
The null hypothesis is valid until it is proven wrong. The burden of truth rest with the alternative hypothesis. This is done by collecting data and using statistics with a specified amount of certainty. The more samples of data usually equates as more evidence and reduces the risk of an improper decision.
The null hypothesis is never accepted, it can be "failed to reject" due to lack of evidence, just as a defendant is not proven guilty due to lack of evidence. The defendant is not necessarily innocent but is determined (based on the evidence) "not guilty".
There is simply not enough evidence and the decision is made that no change exists so the defendant started the trial as not guilty and leaves the trial not guilty.
Alternative Hypothesis characteristics:
- Denoted as "HA"
- Has the burden of proof
- Represents "a difference" or "a change"
- Factor is statistically significant
- Population does not follow a normal distribution
- Variation is from non-random sources.
Examples of Hypothesis Testing Claims
The shape of a distribution is normally distributed
- Ho = Data is Normal
- HA = Data is not Normal
There is a relationship between sales of a toy and placing it on the ends of aisles
- HO: Slope = 0
- HA: Slope does not equal 0
Supplier ABC’s Part # 34565 weight is not the same as Supplier XYZ’s
- Ho= Mean ABC = Mean XYZ
- HA = Mean ABC does not equal the Mean XYZ
People that eat carrots have better eyesight
- Ho = eating carrots and eyesight are independent
- HA = eating carrots and eyesight are dependent
Running more tests allows you to hone in on the differences and conclude more information that can lead to more effective improvements. There are ways to improve the accuracy of results such as being more specific with testing.
For example, testing for specific numerical differences or looking for differences (or lack of) within a gender, a region, an industry, an age group, a religion, an affiliation, or combination of them.
If you detect a change from large group of people from another that is helpful.....but what about more detail?
Therefore, if possible, test the data by gender, by age group, by hair color, by religion, by political party affiliation, by region, etc. You will begin to identify more meaningful information and generate new discussion.
EXAMPLE:
A study of frisbees is being done to determine if the diameter is being manufactured at 14.5 inches in diameter. Whether they are less than 14.5 inches is not important. However it is important to know whether or not the mean is greater than 14.5 inches. A sample of 49 frisbees is reviewed and the mean diameter is 14.75 inches with a standard deviation of 0.30 inches. The data meets the assumptions of normality. Test at a 95% CL.
1) Which hypothesis test should be used? 1 sample t
2) What is HO? Mean = 14.5 inches
3) What is HA? Mean > 14.5 inches
4) What is value of alpha-risk? 0.05
5) What is n? 49
6) Is this a 1 or 2 tailed test? 1-tailed
7) Therefore, what is Zα ? 1.64
8) What is the test statistic (x-bar)? 14.75 inches
9) What is t-calculated? μo + Zα * (σ/√n)
14.75 + (1.64)(0.30 / √49) = 14.75 + (1.64)(0.0428571) = 14.75 + 0.07 = 14.82 inches
10) Since the test statistic is 14.75 inches and the calculated statistic is 14.82 inches, the null hypothesis is inferred that the mean of the population is equal to 14.75 inches.
Do I choose One-Tailed or Two-Tailed?
If the problem or the test is asking for a directional inequality, such as greater than or less than, then it is a one-tailed test.
- If greater than, it is a one-tailed test in the right tail.
- If less than, it is a one-tailed test in the left tail.
If there is no specified direction, such as not equal, then it is a two-tailed test where both the right tail and left tail are under evaluation.
The hypothesis test is used to determine if the test statistic is in the rejection region(s) or not.
Pooled or Unpooled Test?
A "pooled" t-test assumes is used to compare means among two independent samples and their standard deviations are assumed equal. An "unpooled" t-test assumes the standard deviations are assumed to be not equal. The "pooled" t-test pools the sample standard deviations (not the sample means).
A "pooled" Proportions test assumes both Proportions are equal and "unpooled" assumes both are not the same.
"Pooled" and "Unpooled" use different formulas thus the results will be different.
If unsure which to assume, run the test both ways and understand if the difference in results makes a material impact on your project. If the worst-case result still provides an acceptable outcome, then this assumption may not be worth haggling over.
Selecting the Hypothesis Test
Several hypothesis test flowcharts are available to subscribers at no additional charge along with other free downloads and tools to help a Green Belt or Black Belt. A couple generic visual aids are shown below.
If you have One X and One Y variable and......

If you have >1 X and One Y variable and......

Hypothesis Test Module - Download
 |
This Green Belt training program contains a complete module with lessons and detail about commonly used hypothesis tests. This is often a new area of study for those learning about the Six Sigma methodology and represents a significant challenge on certification exams and in real-life application. |
Hypothesis Testing Guide

Hypothesis Testing on TI-83 or TI-84 Calculator

Search active job openings related to Six Sigma
Recent Articles
-
Process Capability Indices
Oct 18, 21 09:32 AM
 Determing the process capability indices, Pp, Ppk, Cp, Cpk, Cpm
 -
Six Sigma Calculator, Statistics Tables, and Six Sigma Templates
Sep 14, 21 09:19 AM
 Six Sigma Calculators, Statistics Tables, and Six Sigma Templates to make your job easier as a Six Sigma Project Manager
 -
Six Sigma Templates, Statistics Tables, and Six Sigma Calculators
Aug 16, 21 01:25 PM
Six Sigma Templates, Tables, and Calculators. MTBF, MTTR, A3, EOQ, 5S, 5 WHY, DPMO, FMEA, SIPOC, RTY, DMAIC Contract, OEE, Value Stream Map, Pugh Matrix -
Six Sigma, Six Sigma Training, Courses, Calculators, Certification
Aug 15, 21 10:27 PM
 One site with the most common Six Sigma material, videos, examples, calculators, courses, and certification.

Site Membership
LEARN MORE
Six Sigma
Templates, Tables & Calculators
Six Sigma Slides
Green Belt Program (1,000+ Slides)
Basic Statistics
Cost of Quality
SPC
Control Charts
Process Mapping
Capability Studies
MSA
SIPOC
Cause & Effect Matrix
FMEA
Multivariate Analysis
Central Limit Theorem
Confidence Intervals
Hypothesis Testing
Normality
T Tests
1-Way ANOVA
Chi-Square
Correlation
Regression
Control Plan
Kaizen
MTBF and MTTR
Project Pitfalls
Error Proofing
Z Scores
OEE
Takt Time
Line Balancing
Yield Metrics
Sampling Methods
Data Classification
Practice Exam
... and more