|

 content.")

7-Wastes
The 7-Wastes represent various forms of non value-added losses. The ideal state for a process (value stream) or product should remove or minimize as much waste as possible before closing the project. The term Muda is used to describe the 7-Wastes.
A typical process, when truly studied, in its natural state before improvements usually has <5% of value-added activity! This is often a startling result, but screams....opportunity. On top of that, consider rework loops which are not typically shown on a VSM.
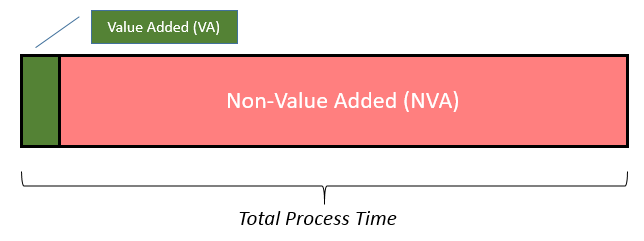
That means that often 95% of the activity is activity that the customer is not willing to pay for or is not required due to law, regulation, or business standards.
Why do something if it's not required or if the customer isn't willing to pay for it?
Use the 7-Wastes thought process when making improvements to the process map to help achieve the ideal state. Each of them is rather obvious when studied individually however it is easier said than done which refers to actually "seeing" the waste, identifying it, and eliminating it (or mitigate).
Again, it seems like common sense and most of it is; however, if the process has been done a certain way over an extended period of time, then these wasteful steps have somehow become overlooked or accepted.
Why is it still being done that way if the waste is so logical and obvious? Use the 5-WHY tool and challenge, challenge, challenge, the current paradigm and even review the laws, regulations, and standards (they also change over time).
Money talks.... if the customer knows they can get a price reduction (and your company gets to keep some profit too), then they may be willing to change a policy or work with you to create an exception.
Furthermore, although a process may be value-added, it is possible to improve on its value by examining each one in these seven areas. There may be small elements of waste or losses with a value-added step.
A product line may include sorting, inspections, certain levels of scrap, and more, but if the competition can eliminate them, they will become the lower cost provider.
Why else is this important?
The primary objective in the removal of waste is to reduce the amount of time in the Order Production Cycle where starts at the time from of receipt of an order (often in the legal form of a Purchase Order) to the time of receipt of payment. In other words, reduce or compress the cash conversion cycle which is also a primary objective of Lean Manufacturing.
The goal is to get paid for an order a close to the time as you have to spend money to make that product or service. In some cases, you may be able to get prepaid.
The quicker a payment is received, the lower the cost of borrowing for the company and gives the company an opportunity to invest or otherwise apply that money. This can lead to further hard and/or soft savings.
What are the 7 Wastes?
There are a few creative acronyms or mnemonic abbreviations to help remember the 7-Wastes or the 8-Wastes. A couple are shown below.
DOTWIMP (shown below for the 7-Wastes) and DOWNTIME (explained later).
1) Defects (Rejects, Repair, Rework)
Parts or units that do not meet the customer specification. Defects always require some degree of additional attention, whether it they are tracked, scrapped, reworked, or repaired. And these options may result in more waste or others of the seven wastes. Remember to consider all the confusion and delays that might have been associated with the scrap or rework.
2) Over Production
Building an excess quantity of units or more than the customer needs or is willing to pay for. This could be due to long set-up times, very long lead times, and difficulties known at start-up. This is often done to cover an underlying problem. This type of waste is the most critical waste type to control since it involves the other six wastes.
This is the most important waste of the 7-wastes to control.
3) Transportation
Examples: Manually moving stock to a staging area and dropping off material and picking it back up to deliver to machine. Minimize the transportation and people involved in moving material. Transportation waste should be evaluated in the office and manufacturing floor. Sometimes it is electronic waste in the corporate environment. Review transportation waste of any materials (direct or indirect).
4) Waiting

Downtime waiting for parts, components, raw materials, approvals, the previous operation down in a cell, and paperwork.
A machine could be waiting for next job, because the current job is being overproduced. It could be the part is waiting for something or the people involved are waiting.
Once again, waiting can be a waste that occurs in a transaction and "front office" related too, such as waiting for a requisition to be approved, purchase order, or others to join a meeting.
5) Inventory (excess)

Not all inventory is "bad" inventory. A properly sized Kanban or plan for each unit will dictate the appropriate amounts of inventory at each phase of a value stream. Moreover, the Kanban mins and max levels should be dynamic and adjust as conditions change. It should be capable of looking forward for potential outliers and using historical performance. Of course, if a business model exist where all inventory is prepaid by customer and “none” is tied up as working capital, then that is ideal. Most often, this isn’t possible.
Parts on hand that customer has not purchased yet due to cycle time and lead time. Buffer stock used to offset variation in demand and production. Excess inventory ties up cash, creates extra handling, storage, and may never be recovered. This is a critical metric towards improving working capital.
QUESTION:
In Lean Manufacturing, the best way to handle excess inventory out of the choices below is
1) Kanban or Pull System
2) Control Plan
3) Value Stream Map
4) Kaizen Event
Answer: Kanban or Pull System.
6) Motion
Excess motion to adjust a machine, frame a house, make a
reservation, that could be done by rearranging layout, tools, and
personnel. The motion may cause unnecessary fatigue and long-term
injury. Proper ergonomics should be applied when making adjustment to
motion studies.
Only have the necessary tools, materials,
paperwork at the operator workstation. The less an item is needed, the
further away it should be. A term commonly used is POU - Point Of Use.
Use shadow boards and other ideas to keep most frequent needed items at
the operator point of use.
This applies for desk jobs, machine operators, supervisors, and at home. The Spaghetti Diagram tool is commonly used to identify opportunities to reduce motion.
7) Processing (Excess or Unnecessary)
This is different than the waste of Overproduction. The
waste of Excess Processing includes waste such as over polishing parts, sorting
parts that don’t need to be sorted, heating parts at too long or too
high of temperature, excessive washing, redundant paperwork, excessive
data collection, tumbling, turning, drying parts longer than necessary,
and applying excess paint.
Another common opportunity in
manufacturing and tool shops is reducing the production of a part from
multiple machines to fewer or one machine, such as putting two
components on at the same time, or redesigning tooling to create more
complex stamping in one cycle.
Overheating and over
air-conditioning buildings or your house, excessive lighting, excessive
use or pumping of oil, excessive electrical consumption are all indirect
forms of over processing. Infrared imaging is a predictive maintenance
technique that can identify hot spots to reduce electrical use and
prevent an unplanned failure and expenses associated.
Try to
substitute gravity for air lines, shaker trays, vibratory mechanisms.
Not only does this eliminate ongoing maintenance, but it also reduces the consumption of natural resources and money. Air leaks are noisy and expensive. Best of all they are usually are easy to fix resulting in a quick and easy way to reduce consumption of electricity from air compressors.
This effort also reduces an organization's impact on the environment and should be noted to benefit programs such as ISO-14001.
The
lack of integrated systems, lack of creative and innovative
spreadsheets, conditional formatting, validation, filtering, can all
lead to over-processing when performing data entry or other clerical and
office jobs.
|
|
|
Actually #8 - Personnel Under Utilization
A company can get the most from its people where the people can apply their strengths most often. The misuse or under-utilization or human resources can even lead to many of the other waste such as poor layout design, ineffective standard work, over production, etc.
This is also referred to as non-utilized talent or skills.
Everyone can contribute to varying degrees and finding and enabling those most valuable contributions is challenging. Some are obvious since their job title can reflect their general expertise, but they may have other experiences and strengths to offer.
Leaders and managers need to ask the right questions and learn by listening and continuously strive to get the most practical output from each person while maximizing employee satisfaction.
Companies should keep employees motivated and show interest in their ideas. Create methods to foster innovations and promote a culture of autonomy. Ensure people are in the correct position and get a chance to contribute.
Meetings, presentations, conference calls are high risk areas of wastes. Trying to keep them short, to the point, with only the right people, and avoid the "lack of communication" issue, is a delicate balance and is almost impossible to perfect once, yet alone on a regular basis.
An acronym to help recall the 8-Wastes is: DOWNTIME
D = Defects
O = Overproduction
W = Waiting
N - Non-Utilized Talent
T =Transportation
I = Excess Inventory
M = Motion
E = Excess Processing
Free Download - PowerPoint Slides
|
|
Click here to download this tutorial along with several others that are available. Contact us at sixsigmamaterial@gmail.com if you don't see a topic that you're looking for, and we'll do our best to find something. |
Templates, Tables, and Calculators
Lean Sigma Practice Exam (180+ questions)
Link to the newest Six Sigma Materials
Return to the Six-Sigma-Material Home Page
Recent Articles
-
Process Capability Indices
Oct 18, 21 09:32 AM
 Determing the process capability indices, Pp, Ppk, Cp, Cpk, Cpm
 -
Six Sigma Calculator, Statistics Tables, and Six Sigma Templates
Sep 14, 21 09:19 AM
 Six Sigma Calculators, Statistics Tables, and Six Sigma Templates to make your job easier as a Six Sigma Project Manager
 -
Six Sigma Templates, Statistics Tables, and Six Sigma Calculators
Aug 16, 21 01:25 PM
Six Sigma Templates, Tables, and Calculators. MTBF, MTTR, A3, EOQ, 5S, 5 WHY, DPMO, FMEA, SIPOC, RTY, DMAIC Contract, OEE, Value Stream Map, Pugh Matrix
Recent Articles
-
Process Capability Indices
Oct 18, 21 09:32 AM
Determing the process capability indices, Pp, Ppk, Cp, Cpk, Cpm -
Six Sigma Calculator, Statistics Tables, and Six Sigma Templates
Sep 14, 21 09:19 AM
Six Sigma Calculators, Statistics Tables, and Six Sigma Templates to make your job easier as a Six Sigma Project Manager -
Six Sigma Templates, Statistics Tables, and Six Sigma Calculators
Aug 16, 21 01:25 PM
Six Sigma Templates, Tables, and Calculators. MTBF, MTTR, A3, EOQ, 5S, 5 WHY, DPMO, FMEA, SIPOC, RTY, DMAIC Contract, OEE, Value Stream Map, Pugh Matrix -
Six Sigma, Six Sigma Training, Courses, Calculators, Certification
Aug 15, 21 10:27 PM
 One site with the most common Six Sigma material, videos, examples, calculators, courses, and certification.

Site Membership
LEARN MORE
Six Sigma
Templates, Tables & Calculators
Six Sigma Slides
Green Belt Program (1,000+ Slides)
Basic Statistics
Cost of Quality
SPC
Control Charts
Process Mapping
Capability Studies
MSA
SIPOC
Cause & Effect Matrix
FMEA
Multivariate Analysis
Central Limit Theorem
Confidence Intervals
Hypothesis Testing
Normality
T Tests
1-Way ANOVA
Chi-Square
Correlation
Regression
Control Plan
Kaizen
MTBF and MTTR
Project Pitfalls
Error Proofing
Z Scores
OEE
Takt Time
Line Balancing
Yield Metrics
Sampling Methods
Data Classification
Practice Exam
... and more