|

 content.")
Measurement System Analysis (MSA)
Measurement system analysis (MSA) uses scientific tools to determine the amount of variation contributed by the measurement system.
It is an objective method to assess the validity of a measurement system and minimize the factors contributing to process variation that are actually stemming from the measurement system. It is designed to assess the statistical properties of gage variation.
The steps below are generally followed with a goal of obtaining acceptance for each of the five criteria.
.")

FIRST OBJECTIVE
The first objective of the MSA is to validate the measurement system used to collect the data before moving onto the ANALYZE phase and running statistical tests. Within this analysis, you will quantify both the:
- Process variation
- Appraiser (device) variation
to get the Total Measurement System variation.
The measurement system variation could be from a variety of sources such as:
- people making decisions such as inspectors making subjective decision (i.e. a human being looking at a baseball card and assigning it a value based on its condition).
- an actual measurement tool providing a numerical reading (i.e. an infrared thermometer reading the temperature of parts as they are heat treated).
- using an improper device to come up with a reading (i.e. a machine operator using a caliper to measure the diameter of a part).
- systematic error creating bias due to not being calibrated correctly (i.e. a scale that is always 3% off)
- sounding or recording error whereas a data recorder doesn’t use enough significant digits or simply incorrectly records the measurement. These are human and estimation errors.
SECOND OBJECTIVE
Secondly, minimize the measurement system variation and its impact on the Total Variation so the amount of Process Variation can be understood as precisely as possible.
The following components of measurement error need to be quantified and passed before establishing process capability and making decisions from the data.
- RESOLUTION / DISCRIMINATION
- ACCURACY / BIAS
- LINEARITY
- STABILITY
- REPEATABILITY & REPRODUCIBILITY (Gage R&R)
CAUTION:
The MSA is often a very time-consuming component of the Six Sigma DMAIC project and can slow the team’s quick progression through the process.
Continue to focus on low hanging fruit that may be momentum "sustainers" and work vigorously through the MSA process. Most of this work can be done by the GB/BB outside of the team meetings.
This is one of those points in the DMAIC cycle where a Black Belt can get hung up early and all momentum can get derailed. Be ready to muscle through this phase and avoid Paralysis from Analysis which is one of the Project Pitfalls to avoid.
Components of Variation
TOTAL OBSERVED VARIATION
= ACTUAL PROCESS VARIATION + MEASUREMENT SYSTEM VARIATION
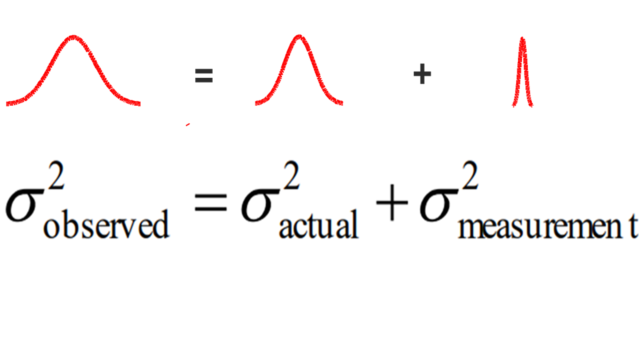
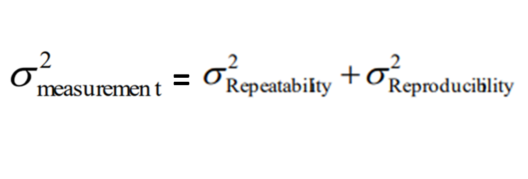
Next, breaking down the MEASUREMENT VARIATION.
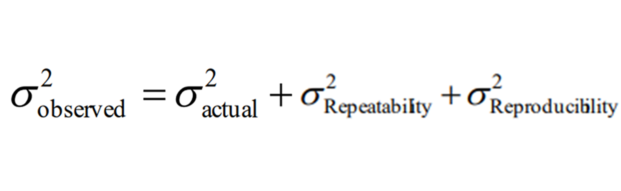
now all together,
Types of Error
Two Types of Error:
1) Random
Error due to chance and natural inherent variation. There is always some variability when taking measurements. One way to combat random error is Replication. Replication is repeating a measurement or experiment several times and often randomizing the recordings (or questions) in each replication. Then assessing all the data together.
2) Systematic
Measurements that are consistently different from the true value, biased, due to a specific cause instruments or the procedure. Four areas of systematic error:
- Theoretical
- Environmental
- Instrumental
- Observational
Sources of Measurement Error
The measurement system error could be a variety of sources such as:
- people making decisions such as inspectors making subjective decision, (i.e. a human being looking at a sports card and assigning it a condition value based on their human review).
- an actual measurement tool providing a numerical reading.
- a person using an improper device to come up with a reading (i.e. a machine operator using a caliper to measure the diameter of a part).
- A person under peer pressure to answer a survey with a certain response (bias)
- A survey that has “biased” questions or selection for responses.
- systematic error creating bias due to not being calibrated correctly (i.e. a scale that is always 3% off).
- rounding or recording error where as a data recorder doesn’t use enough significant digits or simply incorrectly records the measurement. These are human and estimation errors.
- purposeful negligence.
Lets go over the MSA process
Resolution / Discrimination
Also sometime referred to as Gage Sensitivity.
The goal is to have at least 5 distinct values or categories of readings.
Adhere to the 10-bucket rule. If your measurement system requires measurements to the hundredths (x.xx), then divide that by 10. Collect and record the data to the nearest thousandths (x.xxx). The measurement system shall be sensitive to change and capable of detecting change.
A lack of resolution will not allow a measurement system to detect change. If you're measuring downtime and using measurements to the nearest hour and most of the downtime events are less than an hour, then most of the readings will either be a 0 (for 0 hours) or a 1 (for 1 hour). This isn't going to provide enough resolution or granularity.
However, using a stopwatch and recording data to the nearest minute will provide 60x more resolution and allow better distribution of data points with fewer repeat measurements. You could have 60 different readings. Actually, recording to the nearest 6-minute interval would satisfy the 10-bucket rule, but 10-bucket is a minimum guideline to help ensure there is enough resolution in the measurement system.
This part of the MSA is usually the easiest to fix such as finding a micrometer, caliper, hardness tester that is capable of measuring to the next nearest decimal.
To address a resolution issue try acquiring a larger samples size with the goal that some of these may create new observations or measurements.
In summary, measure with as much resolution as possible and practical.
Accuracy / Bias
The difference from the true value and the value from the measurement system. Accuracy represents the closeness to a defined target. Precision is different than accuracy and is covered in Gage R&R under Repeatability (illustration below).
Positive bias indicates that the gage is measuring high and a negative bias means the gage is measuring low.
For the best assessment of the 'Accuracy' of the data:
- Accept all data as collected. Assigning special cause and scrutinizing data comes later.
- Record the data at the time it occurs.
- Avoid rounding off the data (rounding can create resolution problems).
- On the data collection plan, record as many details around the data such as the exact source, machine, operator, conditions, collector’s name, material, gage, and time. Record legibly and carefully. The data should be screened for misplaced decimal points, duplicate data entries by mistake or improper recording procedure, missing data points (if frequency is important), and other obvious non-representative data.
- Verify the gage is accurate. If using a weigh scale, verify it with a known and calibrated weight. Use gage blocks for calipers or micrometers. Use hardness blocks to verify hardness testers.
Assess the p-value to determine whether the bias is statistically significant. The lower the p-value the stronger the assumption that the bias is 0 is likely not true.

Linearity
Linearity is a test to examine the performance of the measurement system throughout the range of measurements. When gathering data only collect with the acceptable limits where there is proven linearity.
Linearity represents the change in accuracy (bias) through the expected operating range of a measurement device. Linearity is assessed to determine if the gage has the same accuracy (bias) across all reference values.
Sources of linearity error may come from age, wear, calibration error, or there may be known linearity error. If there is known error then there may be a calculation to account for it and various ranges of measurement.
For example, does the bathroom scale perform the same when weighing a pet of 10 kg to a man of 90 kilograms? The scale has an operating range of 0 kg to 100 kg but the scales accuracy may change at various levels of measurement.
 Linearity at Six-Sigma-Material.com
It's clear that the scale becomes more inaccurate as the weight increases. You may be able to use the scale up to about 20kg.
Corrective actions for linearity issues may be:
- use only in the acceptable range
- repair and/or calibrate device
- update Work Instructions and improve training
- apply a correction factor/table/curve
For a gage that measure consistent across reference values, the % Linearity will be near 0.
Stability
Stability (also referred to as "drift") of a measurement system can be analyzed using control charts. Ensuring the measurements taken by appraiser(s) for the process indicate stability and consistency over time.
Each appraiser should measure the same way every time over a long period of time and each appraiser should measure the same way as all the others.
Stability is the total variation (spread and shape of the data distribution) of the measurements using the same parts, measured using the same gauge over a long period of time.
SPC Charts use a variety of tests to determine stability. Many software programs will have these as options when analyzing data and will even indicate the point(s) and test that each failed.
Some of the corrective measures once again include Standard Operating Procedures and re-calibration. Sometimes the gauge will have wear from use over a long period of time and this cannot be repaired or re-calibrated. Other times, there may be a buildup of dirt, dust, or contamination.
Reminder:
Special cause variation can also occur within the process control limits and these must be given corrective action before proceeding to validate the measurement system.
The I Chart below shows stability in this measurement system example, assuming this is a "longer" period of time that represents actual conditions as close as possible.

Gage R&R
Variable Gage R&R
In a Variable Gage R&R there are generally 2-3 appraisers with 5-10 process outputs (such as a widget or the part being manufactured) measured by each appraiser. And each process output is measured 2-3 times by each operator. Depending on the cost and time involved you can add more appraisers and measurements and replications.
When performing the replicated appraisals, it's critical that the measurements are randomized so that no patterns or predictability can be entered in by the appraiser. This bias will mislead the team and create a useless Gage R&R.
For example, an appraiser may remember the 7th part that was measured was borderline and made a decision to give it one measurement. The appraiser may have spent a lot of time on that part in the initial assessment and if the 2nd round of measurements is not randomized, that person could remember the measurement (appraisal) they concluded during the first round.
In summary, the point is to move the parts around each repetitive set of measurements. However, the parts must be identified so the person entering the data into the statistical software enters the reading under the correct part.
Four Criteria in Variable Gage R&R
The following four areas will be assessed. A statistical software program will generate these values once the data is entered. The GB/BB will be responsible for finding these values and determining whether each passes and if the entire measurement system is adequate to determine process capability. Process capability can not be determined with reliability if the measurements (the data) are suspect.
- % Study Variation is based on standard deviation
- % Tolerance is based on USL and LSL
- % Contribution is based on variance
- The number of distinct categories based on process variation
Ideally, all four categories should be in the GREEN zone. Examining the visual aids below shows commonly used judgement criteria for each category.

2) % Tolerance
Shown below is an example of a % TOLERANCE calculation. In this case we are using 3 appraisers measuring 6 different parts.
This study shows the measurement error as a percent of tolerance in short period of time. It includes both repeatability and reproducibility, cannot be separated.
5.15 Study Variation = 99% (constant)
The UPPER TABLE at the top is a part of the d2 distribution. This value is a constant that is found by looking at the column with 3 appraisers and going across with the row with 6 parts. In this example the d2 value is 1.73.
Click here for a more in depth background and table on the constant, d2
The LOWER TABLE shows that actual measurements that each of the appraisers came up with using their variable gage. The range of the three measurements for each part is shown on the right. Then the average range is shown (= 0.69) and this is carried on to the Gage Error formula.
 Six-Sigma-Material.com
To convert this gage error of 2.05 to a percentage of tolerance multiply by 100 and divide by the process tolerance for the analysis.
The process tolerance is the difference in the specification limits. For example, if the USL is 27 and the LSL is 2, then the tolerance is 25.
With the tolerance being 25, then:

Referring back to the RED/YELLOW/GREEN criteria display for % TOLERANCE, it's shown that 8.2% is a passing value and this part of the Variable Gage R&R is acceptable.
REPRODUCIBILITY
Reproducibility is the ability of one appraiser to get the same result and another appraiser or the ability of all appraisers to get the same results AMONG each other.
To optimize reproducibility in ATTRIBUTE Gage R&R:
1) Create visual aids, templates, definitions, or other specific criteria for each to meet a certain rating, value, or appraisal. Pictures of good, bad, in the middle, and colors, will help each appraiser standardize their response, improving the reproducibility.
Note: If these corrective actions are needed to pass the Gage R&R, it should be instituted as a formal Work Instruction and everyone involved throughout the company or plant should adhere to same instructions.
To optimize reproducibility in VARIABLE Gage R&R:
1) Create a Standard Operating Procedure with visual aids and definitions. When using humanly subjective "touch" devices such as micrometers and calipers it is important that all appraisers "squeeze" the same amount. Too little or too much pressure at higher levels of resolution can be enough to alter the Gage R&R.
2) Visual aids also help. When using an optical comparator to get a higher resolute data point there is subjectivity where to place the template or the starting and end point(s) on the shadow. Pictures of acceptable and non-acceptable will help reduce this variation. Templates of complex figures or shapes also help reduce subjectivity and improve R&R.
Repeatability is associated with Precision and Reproducibility is associated with Reliability
REPEATABILITY
This describes the ability for an appraiser to repeat his/her measurements each time when analyzing the same part, unit, etc. In destructive testing (such as tensile testing) these reading will not be possible and some statistical software programs have options to select for destructive testing.
The goal is to have an appraiser repeat unit readings at least three times. The person administering the test should randomize the sequence each time to prevent and patterns and bias (the appraiser may remember or try to remember what a measurement was and tend to alter real measurements to get the Gage R&R to pass). It is important for the administrator to record carefully to ensure readings correlate the correct part/unit each time.
Avoid writing down measurements and then typing them into a statistical program. The fewer times measurements are recorded and copied the lower the risk for human error to add even more variation and possibly fail (or pass) the Gage R&R when it shouldn't have.
Precision is the ability to have the same repetitive result (or appraisal in this case). Visually, it means that all your shots of an arrow are very close to one another. It does not mean that they are near the bullseye. In other words, it does not mean that your shots are accurate.
If your shots are accurate and precise, then they are tight circle centered around the target.
It is also possible to be accurate without being precise. For example, there may be several shots all around the bullseye (target) but they may be scattered all around it in a large diameter cluster (area).
If you take a look at the group, the center (mean) may be on the bullseye, but the shots are not in control or precise. In other words, there is a lot of unpredictability or variation. This would represent a set of data with an acceptable mean (on target) but too much variance (high standard deviation).
This is the essence of Six Sigma. The methodology focuses on VARIATION REDUCTION (precision) as primary goal and then with the inputs under control, the mean can be shifted if it is necessary. It is not possible to shift the mean with sustainability without having process control (control over sources of variation).
MSA - Gage R&R Process Example
The picture below is shown to help illustrate how the assessment process can be done for a Gage R&R for either an Attribute or Variable MSA.
In this case, 30 bolts are randomly placed on a number. Before the process starts a team assigned a Master (Known) value or assessment for each of the bolts. In other words, each bolt is already known to be a PASS or FAIL.
In this case it is an Attribute MSA and the Master values are PASS or FAIL for each bolt.
Each bolt is identified on the bottom with a PASS or FAIL indicator; however, the appraisers are not aware of these markings.
NOTE: This could also be a Variable MSA if the goal was to assess the length or diameter of the bolts.
 Measurement System Analysis
There are 3 appraisers. Each appraiser will make a decision (PASS or FAIL) on each bolt two times.
After each round of measurements, the person coordinating the MSA will move the bolts around to a different number to randomize the assessment. This helps ensure the appraiser does not remember how they assessed a bolt the previous round. This is absolutely critical to remove bias (use randomization) from the assessment.
The results are recorded carefully onto a spreadsheet from which the Six Sigma Project Manager will begin the Measurement System Analysis.
The Six Sigma Project Manager will be evaluating three areas:
- Comparing each appraiser to the Master values
- Comparing each appraiser results to the other appraiser results. This is the "among" variation.
- Comparing each appraisers results to themselves. In other words the "within" variation. How were the results from Round 1 compared to their own Round 2 results.
If the MSA is perfect, that means all appraisers agreed with the Master values on both rounds and they all agreed with the other appraisers both rounds, and they matched their own assessments each round.
Interpreting the MSA results
The questions below help examine the extreme outcomes to demonstrate the main points and provoke thoughts and ways to consider all the data that is generated from a MSA.
Understanding these situations will help understand more complicated and the nearly infinite number of outcomes that can occur within these extremes.
What if all appraisers decided that one bolt PASSED while the master value was FAIL?
This brings into the question of the Master values...are they actually correct? And if they are all correct, then all appraisers in need of additional training on the criteria to assess an acceptable part for an unacceptable part.
What if all appraisers decided that one bolt FAILED while the master value was PASS?
Same response as above.
What if one of the appraisers doesn't match their own decisions on any of the previous round decisions?
That appraiser is inconsistent and is not using the same criteria (whether objective or subjective) in making an assessment. This could be helped by clearer instructions, definitions or discipline by the appraiser to adhere to the instructions.
What if one of the appraisers matches all of their own readings on both rounds?
Excellent. that appraiser is consistent within him/herself. But does the consistency match the Master values?
Building on the previous question, but what if none of the readings match the Master value?
The person is consistent (precise) but not at all accurate. This likely is going to require additional training and back to the basics.
Attribute Gage R&R Example One
Using the example of data gathered from two appraisers assessing 20 samples as Good (G) or No-Good (NG) draw your conclusions on the outcome.

Attribute Gage R&R Example Two
Take a look at the results below and make decisions on how to proceed. There is a lot of valuable information here, they key is interpreting it correctly and making improvements if needed.
There were 3 appraisers, a set of Master values (called the Standard), and each appraiser made 2 randomized assessments of each part as PASS or FAIL.

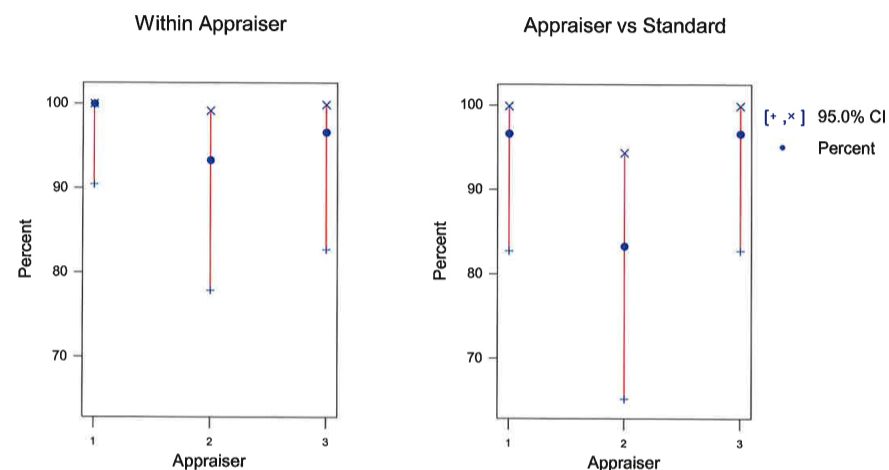
Evaluating the "Within Appraiser" section, Appraiser 1 matched all his/her readings on both assessments and Appraise 2 had two instances out of 30 trials that did not match.... What are your thoughts?
Appraiser 2 should get some additional training right....well not necessarily. What if all of Appraiser 2 readings matched the standard (Master values)?
Looking at the next section "Each Appraiser vs Standard", notice the only 25 / 30 readings matched the standard from Appraiser 2. Thus 5 parts were assessed incorrectly compared to the Master values. This could either be a PASS decision when the standard was FAIL or vice versa.
One takeaway is that Appraiser 2 could use additional training or the Work Instruction could be improved to make it clearer as how to proper assess a good part from a bad part.
From the "Between Appraisers" section, notice that 24 / 30 readings matched each other across all two trials. That brings the lower level of the Confidence Interval down to 61.4%.
Depending on how critical this assessment is or how critical the bolts applications is, generally you would like 29/30 where all assessments (>95%) match each other, each assessor repeats the same response on both trials, and they match the Master value.
This MSA does not pass!
The team should come up with improvements to make the assessment process more effective. This could include visual aids, actual good and bad parts for the appraisers to study, discussions with the customer, more detailed work instructions, discussions among all the appraisers.
Once all the improvements are done, another Gage R&R should be done to prove the results. This is where it can get very time-consuming and this is where a MSA can become a project within your project. Consult your Master Black Belt if the MSA continues to be a roadblock. This is one of the top Project Pitfalls to watch out for as a GB/BB.
Variable Gage R&R Example
Examining the output of a measurement system analysis below what conclusions can be drawn?

As mentioned before, cleaning up a measurement system can elevate hidden causes of scrap, rework, customer concerns and a lot of cost itself....and it can turn into a project itself.
Expect to update or create new Standard Operating Procedures (or work instructions) at a minimum to mistake-proof the appraisal process and robust measurement methods so that as much variation as possible is PART to PART.
MSA Training Download
 |
This module provides additional insight in measurement systems analysis. This is critical component of the MEASURE process that is often overlooked or skipped and could lead to incorrect conclusions and rework in the later stages of the DMAIC journey. Click here to purchase the MSA module along with all other topics commonly found within a Green and Black Belt program. |
ANOVA
Analysis of Variance is another technique to analyze sources of variation of measurement error (and for any sources of variation - hence the name).
With statistical software, this method has the advantage over the "average and range" technique since it provides more information, such as interactions between the parts being measured and appraisers.
The variation can be distinguished between four categories:
- Appraisers (those that are measuring)
- Parts or item being measured
- Interaction of Appraisers and Parts
- Replication error from the gauge
Search Six Sigma related job openings
Templates, Tables, and Calculators
Recent Articles
-
Process Capability Indices
Oct 18, 21 09:32 AM
 Determing the process capability indices, Pp, Ppk, Cp, Cpk, Cpm
 -
Six Sigma Calculator, Statistics Tables, and Six Sigma Templates
Sep 14, 21 09:19 AM
 Six Sigma Calculators, Statistics Tables, and Six Sigma Templates to make your job easier as a Six Sigma Project Manager
 -
Six Sigma Templates, Statistics Tables, and Six Sigma Calculators
Aug 16, 21 01:25 PM
Six Sigma Templates, Tables, and Calculators. MTBF, MTTR, A3, EOQ, 5S, 5 WHY, DPMO, FMEA, SIPOC, RTY, DMAIC Contract, OEE, Value Stream Map, Pugh Matrix -
Six Sigma, Six Sigma Training, Courses, Calculators, Certification
Aug 15, 21 10:27 PM
 One site with the most common Six Sigma material, videos, examples, calculators, courses, and certification.

Site Membership
LEARN MORE
Six Sigma
Templates, Tables & Calculators
Site Membership
LEARN MORE
Six Sigma
Templates, Tables & Calculators
Six Sigma Slides
Green Belt Program (1,000+ Slides)
Basic Statistics
Cost of Quality
SPC
Control Charts
Process Mapping
Capability Studies
MSA
SIPOC
Cause & Effect Matrix
FMEA
Multivariate Analysis
Central Limit Theorem
Confidence Intervals
Hypothesis Testing
Normality
T Tests
1-Way ANOVA
Chi-Square
Correlation
Regression
Control Plan
Kaizen
MTBF and MTTR
Project Pitfalls
Error Proofing
Z Scores
OEE
Takt Time
Line Balancing
Yield Metrics
Sampling Methods
Data Classification
Practice Exam
... and more