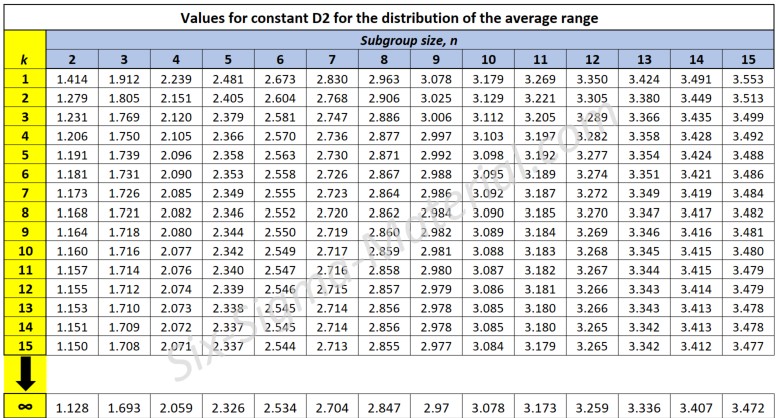
Explaining the constant, d2
In an MSA, d2 is a constant used when calculating an estimate of the process standard deviation from the average range (R-bar) of subgroups. It represents the expected value of the sample range when the underlying distribution is normal with a standard deviation of 1.
The primary use of the d2 constant is to convert the average range (R-bar) of measurements taken within a subgroup into an estimate of the process standard deviation (sigma, σ). This is particularly helpful in process capability analysis and control chart construction when the subgroup size (n) is known.
The formula for estimating sigma (standard deviation) is: σ = R-bar / d2 (aka Study Variation in this case). This standard deviation is often referred to as a measure of "within subgroup variation".
The value of d2 depends on the subgroup size (n) and can be found in tables such as shown below. Most statistical software will have these constants as well.
d2 is often used in conjunction with other control chart constants like d3 and d4. d3 is used to calculate the UCL for range charts and d4 is used to calculate the UCL for X-bar charts.

Recent Articles
-
Process Capability Indices
Oct 18, 21 09:32 AM
Determing the process capability indices, Pp, Ppk, Cp, Cpk, Cpm -
Six Sigma Calculator, Statistics Tables, and Six Sigma Templates
Sep 14, 21 09:19 AM
Six Sigma Calculators, Statistics Tables, and Six Sigma Templates to make your job easier as a Six Sigma Project Manager -
Six Sigma Templates, Statistics Tables, and Six Sigma Calculators
Aug 16, 21 01:25 PM
Six Sigma Templates, Tables, and Calculators. MTBF, MTTR, A3, EOQ, 5S, 5 WHY, DPMO, FMEA, SIPOC, RTY, DMAIC Contract, OEE, Value Stream Map, Pugh Matrix

Site Membership
LEARN MORE
Six Sigma
Templates, Tables & Calculators
Six Sigma Slides
Green Belt Program (1,000+ Slides)
Basic Statistics
Cost of Quality
SPC
Control Charts
Process Mapping
Capability Studies
MSA
SIPOC
Cause & Effect Matrix
FMEA
Multivariate Analysis
Central Limit Theorem
Confidence Intervals
Hypothesis Testing
Normality
T Tests
1-Way ANOVA
Chi-Square
Correlation
Regression
Control Plan
Kaizen
MTBF and MTTR
Project Pitfalls
Error Proofing
Z Scores
OEE
Takt Time
Line Balancing
Yield Metrics
Sampling Methods
Data Classification
Practice Exam
... and more


