Process Capability Index, Cpk
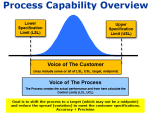
Cpk is a short term process index that numerically describes the "within subgroup" or "potential" capability (Ppk is a long term indicator) of a process assuming it was analyzed and stays "in control". Cpk is one commonly applied metric to measure how a process (aka Voice of the Process VOP) is performing relative to the customer specifications (i.e. LSL, USL, target - Voice of the Customer (VOC)).
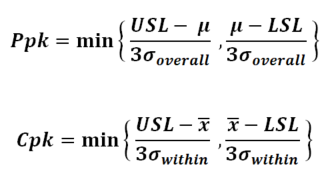
The formula is shown below which is essentially an inverse proportion to the process standard deviation.
NOTE: There are two values calculated and the minimum value (worst case) is used.
When to use Cpk in a Six Sigma Project
Cpk is an option (along with z-score and PPM or DPMO) when describing process baseline measurement in the MEASURE phase. After the MSA is complete, the Six Sigma project has a goal of improving the baseline measurement. In order to measure improvement (or lack of) there must be a starting point. This is called the baseline measurement.
After the improvements are done, the process is measured again and a new Cpk value is calculated in the CONTROL phase.
As with all the process capability indices, the process must be in control before assessing capability. This goes for the baseline measurement and the final measurement.
Use time-series charts and SPC charts to determine process control. If the process is out of control (i.e. still rising with upward trend), then assessing the current process is unlikely to reflect the long term performance.
Cpk cannot be used if the:
- data is not a bell-shaped normal distribution
- control chart is not in control and free from special cause.
It is recommended to have at least 25 subgroups and preferably each subgroup having >1 data point. The greater the subgroups size the higher likelihood the special cause variation is detected and that it exist if it is detected.
Think about it this way, if a subgroup size is 5 and all five data points show an average that is vastly different from the averages of the other subgroups (that also have 5 data points) then there is a strong chance that the subgroup was measured under a "unique" or special condition.
Characteristics of Cpk
What does the "k" mean?
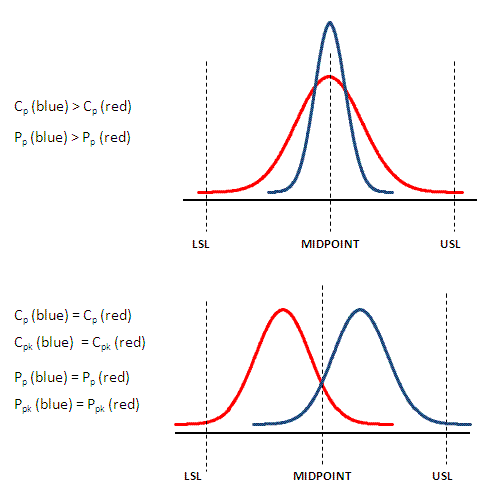
The Cp is the best a process can perform if that process is centered on the midpoint. The Cp is commonly referred to as the process entitlement because, when centered, it represents the best performance possible.
The addition of "k" in Cpk quantifies the amount of which a distribution is centered, in other words it accounts for shifting. A perfectly centered process where the mean is the same as the midpoint will have a "k" value of 0.
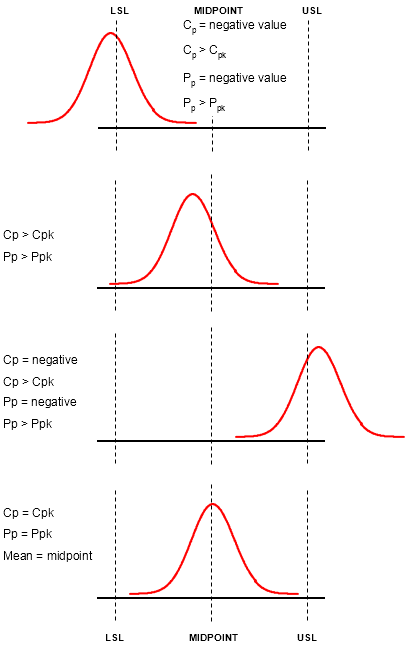
The minimum value of "k" is 0 and the maximum is 1.0. A perfectly centered process will have Cp = Cpk.
Both Cpk and Ppk relate the standard deviation and centering of the process about the midpoint to the allowable tolerance specifications.
An estimate for Cpk = Cp(1-k).
and since the maximum value for k is 1.0, then the value for Cpk is always equal to or less than Cp.
Cpk will never exceed the Cp
The higher the Cpk, the lower the variation in the process.
Similar to Ppk, the Cpk capability index is only a function of the standard deviation and mean of the data, not a nominal (target) value that may be historical or provided by the customer. The Cpm capability calculation accounts for a nominal value.
Cpk also requires input from the customer for the lower specification limit (LSL) and upper specification limit (USL).
There are two calculations from the formula providing two values for Cpk. Select the MINIMUM value as the Cpk and to serve as the baseline value. This minimum value must be equal to or greater than the minimum acceptability level.
Unlike Cp (and Pp), the Cpk (and Ppk) index can be calculated using unilateral or bilateral tolerances. If only one specification is provided (unilateral) the use the value that involves that specification limit.
In such case, there will not be a minimum (or maximum), just calculate using the formula that has a specification and use it for the Cpk value.
- Cp is a measure of variation only.
- Cpk is a measure of location and variation.
- Cp will never be a negative number.
- Cpk can be a negative number.
The standard Cpk level is 2.0 for a process in six sigma quality control. The most relevant acceptability levels for Cpk depends on your customer - the Voice of the Customer.
A Cpk of 2.0 would represent a sigma = 6 which also means there are 3.4 DPMO created by the process in the "short term" which is the performance goal for a Six Sigma project.
Read more about the process capability indices, their meanings, and relationships.
Comparing Cpk and Ppk formulas
Calculating Cpk - Example One
Recall that the specification limits are set by the customer or your company. You may have only the USL and/or the LSL depending on your situation.
Let's assume the following information:
Lower Specification Limit (LSL): 5mm
Upper Specification Limit (USL): 10mm
The mean of your data set consisting of 50 observations is normal and the value is 7.85 mm. The standard deviation is 0.23mm
Find Cpk:
Find both values by substituting the values into the formula at the top of this page
1: (10mm - 7.85mm) / 3 * 0.63mm = 2.15mm / 1.89mm = 1.14
2. (7.85mm - 5mm) / 3 * 0.63mm = 2.85mm / 1.89mm = 1.51
The minimum value is used; therefore, the Cpk = 1.14
Relationship of Capability Indices
Additional Visual Aids
Recommended Video for Cpk and Cp
Cpk and Cp are the two most commonly used capability indices in statistics. This is a video that we recommended to help grasp the similarities, differences, application, and calculations.
Converting from Cpk to a Z-score
With a normally distributed set
of data an approximation of Z from Cpk and vice versa can be made in
substituting and solving within these two formulas.
What is the Cpk approximated from a 6 sigma performance?
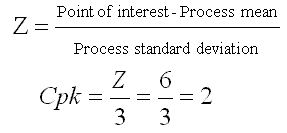
Substituting the Z formula in Cpk (USL) and plugging in 6 for Z from the given data gives:
A Cpk of 2.0 corresponds to approximately 6 sigma (short term) performance or 4.5 sigma (long term) if applying the shift.
In other words, the sigma score (z) is the Cpk * 3.
The Z in the above formula refers to a short term sigma, short term Z.
Click here to learn more about z-scores.
Converting DPMO (or PPM) to Cpk
Remember Cpk takes into account the centering of the distribution of data among the USL and LSL. If the process is centered (k=0) then the defects are equally distributed on both tails. This is the same as converting DPMO to Cp.
Therefore, it isn't possible to convert DPMO (or PPM) to an exact Cpk value unless you know how many DPMO are above the USL and below the LSL.
The best case (which is the highest Cpk score) is:
assume equal DPMO on both sides (split of the total DPMO) which is the same as calculating Cp.
The worst case (which is the lowest Cpk score) is:
assuming all the DPMO are on one tail and that will provide the lowest centering and lowest Cpk value.
Capability Study Module - Download
|
These Six Sigma Training modules provides lessons within Statistical Capability studies and much more. Understanding the basic meaning and applications for capability studies is necessary for any level of a Six Sigma Project Manager. |
Return to Process Capability
Return to the MEASURE phase
Return to the CONTROL phase
Templates, Tables, and Calculators
Return to the Six-Sigma-Material Home Page
Recent Articles
-
Process Capability Indices
Oct 18, 21 09:32 AM
Determing the process capability indices, Pp, Ppk, Cp, Cpk, Cpm -
Six Sigma Calculator, Statistics Tables, and Six Sigma Templates
Sep 14, 21 09:19 AM
Six Sigma Calculators, Statistics Tables, and Six Sigma Templates to make your job easier as a Six Sigma Project Manager -
Six Sigma Templates, Statistics Tables, and Six Sigma Calculators
Aug 16, 21 01:25 PM
Six Sigma Templates, Tables, and Calculators. MTBF, MTTR, A3, EOQ, 5S, 5 WHY, DPMO, FMEA, SIPOC, RTY, DMAIC Contract, OEE, Value Stream Map, Pugh Matrix

Site Membership
LEARN MORE
Six Sigma
Templates, Tables & Calculators
Six Sigma Slides
Green Belt Program (1,000+ Slides)
Basic Statistics
Cost of Quality
SPC
Control Charts
Process Mapping
Capability Studies
MSA
SIPOC
Cause & Effect Matrix
FMEA
Multivariate Analysis
Central Limit Theorem
Confidence Intervals
Hypothesis Testing
Normality
T Tests
1-Way ANOVA
Chi-Square
Correlation
Regression
Control Plan
Kaizen
MTBF and MTTR
Project Pitfalls
Error Proofing
Z Scores
OEE
Takt Time
Line Balancing
Yield Metrics
Sampling Methods
Data Classification
Practice Exam
... and more


