|

 content.")
Xbar-S Control Chart
A Xbar-S (Sigma) control chart is often used together to plot the process mean (Xbar) and subgroup standard deviations (S) over time for continuous data. This control chart, along with I-MR and Xbar-R, are used in measuring statistical process control and assessing the stability of a process.
The S chart is used to review the process variation which must be in control to correctly interpret the Xbar chart. The control limits of the Xbar chart are calculated with the inputs of the process spread and mean. If the S chart is out of control, then the control limits on the X-bar chart may be inaccurate and exhibit Type I or II error.
There are a few commonly used charts to assess process control
These charts are used to verify process control before assessing capability such as Cpk, Ppk, Cp, Pp, or Cpm.
The Xbar chart plots the mean of the each subgroup. The Xbar charts determine whether the process center is in control.
The S chart plots the range of the subgroup standard deviations and is used to determine whether the process variation is in control.
The S chart must be in control in order to properly interpret the Xbar chart. When the S chart is in control, then an out-of-control condition found in the Xbar chart is related to changes in the process center.
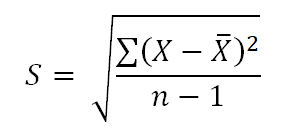
The formula for S is as follows:
Xbar-S Control Chart in Minitab
As with any software, the results will only be as good as the data selected. Make sure that the data in Minitab (Excel, Sigma XL, etc.) is correct. Copying/pasting data from spreadsheets or paper can seem simple but numbers can get missed, decimals moved, etc. Take a few minutes and review the data before you begin to analyze.
When using statistical software to identify special cause in I-MR, Xbar-R, or Xbar-S charts, you can often select which tests to run and change the parameters. There are nearly an infinite number of ways you can run these tests. Most often, the defaults selections are chosen.

Here is another example of a couple of data points that Minitab identifies as special cause. The menus and appearance of the charts will change over time due to revision updates.

Xbar-S Control Chart in Excel
CONTINUOUS DATA:
The three charts above are used when plotting continuous data. Determine whether the data is in INDIVIDUALS or SUBGROUPS.
INDIVIDUALS
Each measurement is free from a rational subgrouping. Each measurement is taken as time progresses and can have its own set of circumstances.
SUBGROUPS
Each subgroup contains data of a similar short term setting (one lot, one shift, one operator).
Easier analysis of subgroup data is done when the amounts of measurements per subgroup are equal. For example, if you are studying the MPG of a car at various speeds, collect the same amount of data points for each interval of speed.
However, this isn't a requirement for most statistical software programs. Use caution when classifying subgroups in the statistical software. Align the data set by subgroups and input the correct sample size of the subgroup as the software needs.
For subgroups <=8, use the range to estimate process variation: X-bar, R. For example, if appraisers are measuring parts every 30 minutes and they sample and measure 6 consecutive parts each 30 minute interval then the subgroup size is 6 and the range should be used to estimate the process variation.
For subgroups >8, use the standard deviation to estimate variation: X-bar, S. Using the above example; however, every 30 minutes the appraisers are sampling and measuring 15 consecutive parts then the subgroup size is 15 and the standard deviation becomes a better choice to estimate the process variation.
In the above examples, it is the subgroup size that matters, not the total amount of subgroups collected. You can collect as many subgroups as needed...within reason.
Why is rational subgrouping important?
These represent small samples within the population that are obtained at similar settings (inputs or condition) over short period of time. In other words, instead of getting one data point on a short term setting, obtain 4-5 points and get a subgroup at that same setting and then move onto the next. This helps estimate the natural and common cause variation within the process.
Individuals type of data (I-MR) is acceptable to measure control; however, it usually means that more data points (longer period of time) are necessary to ensure all the true process variation is captured.
Sometimes this can be purposely controlled and other times you may have to recognize it within data. Sometimes a Six Sigma Project Manager will be given data without any idea on how it was collected.
The Six Sigma Project Manager needs to take the time and review the source, sampling method, and determine those details before using the data to run hypothesis tests and draw conclusions.
SPC Quiz
A Black Belt is looking to monitor a machining process after the project is closed. It's decided to collect 12 piece samples daily (subgroups of 12 pieces) to measure the diameter of each part. The appropriate control chart is:
A: Xbar-S
B: I-MR
C: np
D: Xbar-R
Answer: A
180+ additional practice certification problems are available to subscribers which covers all areas of DMAIC. Click here to learn about the other benefits of subscribing.
Templates, Tables, and Calculators
Search Six Sigma related job openings
Subscribe to get access to the entire site with free downloads
Recent Articles
-
Process Capability Indices
Oct 18, 21 09:32 AM
 Determing the process capability indices, Pp, Ppk, Cp, Cpk, Cpm
 -
Six Sigma Calculator, Statistics Tables, and Six Sigma Templates
Sep 14, 21 09:19 AM
 Six Sigma Calculators, Statistics Tables, and Six Sigma Templates to make your job easier as a Six Sigma Project Manager
 -
Six Sigma Templates, Statistics Tables, and Six Sigma Calculators
Aug 16, 21 01:25 PM
Six Sigma Templates, Tables, and Calculators. MTBF, MTTR, A3, EOQ, 5S, 5 WHY, DPMO, FMEA, SIPOC, RTY, DMAIC Contract, OEE, Value Stream Map, Pugh Matrix -
Six Sigma, Six Sigma Training, Courses, Calculators, Certification
Aug 15, 21 10:27 PM
 One site with the most common Six Sigma material, videos, examples, calculators, courses, and certification.

Site Membership
LEARN MORE
Six Sigma
Templates, Tables & Calculators
Six Sigma Slides
Green Belt Program (1,000+ Slides)
Basic Statistics
Cost of Quality
SPC
Control Charts
Process Mapping
Capability Studies
MSA
SIPOC
Cause & Effect Matrix
FMEA
Multivariate Analysis
Central Limit Theorem
Confidence Intervals
Hypothesis Testing
Normality
T Tests
1-Way ANOVA
Chi-Square
Correlation
Regression
Control Plan
Kaizen
MTBF and MTTR
Project Pitfalls
Error Proofing
Z Scores
OEE
Takt Time
Line Balancing
Yield Metrics
Sampling Methods
Data Classification
Practice Exam
... and more