|

 content.")
Probability Density Function
The Probability Density Function (PDF) is referred to as the shape of the distribution. PDF is used to define the probability of a random variable occurring within a range of values.
As a histogram of the distribution is created with more and more categories, it begins to take on the exact shape of the distribution.
If you were to draw a curved line that fits most of the histogram (created from the samples) it would create a model that describes the population.
- X-axis: represents the z-scores of measurement
- Y-axis: represents, within +/- 0.5 standard deviation, the probability of "x" occurring with each "x" being independent
We will call f(x) the PDF which is the curved line overlaid on the samples of the histogram. The area to the left of x (point of interest) is equal to probability of the x-axis variable being less than the value of x (point of interest). The probability density is the y-axis.
The PDF works for discrete and continuous data distributions. There PDF must be positive for all values of x since there can not be a negative value for probability.
The PDF represents the entire amount of space under the curve and the highest probability that exist is 100% or 1.00 the entire area under the curve = 1.
So, from negative infinity to positive infinity, the area under the curved line is represented by the following integral:


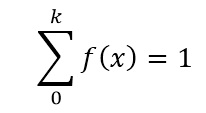
The PDF for discrete data for all values of k with f(x) greater than or equal to 0:
The integral of the PDF to the left of a point of interest, "x", is the Cumulative Distribution Function (cdf).
Normal PDF in Excel
The function NORM.DIST (former Excel version used NORMDIST) calculates the Normal Probability Density Function or the Cumulative Normal Distribution Function.
The Normal PDF is defined by two values:
- Mean
- Standard Deviation
and creates a bell-shaped probability density function.
The mean is the measurement of central tendency and the standard deviation is the spread (or dispersion) of the distribution around the mean.
With "x" as the point of interest, the format of the function is:
NORMDIST(x, mean, standard deviation, TRUE or FALSE)
In the final argument use TRUE for the Cumulative Normal Distribution Function and use FALSE for the Normal Probability Density Function.
What is the CDF and inverse CDF?
Click here to learn about the Cumulative Density Function and its inverse.
Recent Articles
-
Process Capability Indices
Oct 18, 21 09:32 AM
 Determing the process capability indices, Pp, Ppk, Cp, Cpk, Cpm
 -
Six Sigma Calculator, Statistics Tables, and Six Sigma Templates
Sep 14, 21 09:19 AM
 Six Sigma Calculators, Statistics Tables, and Six Sigma Templates to make your job easier as a Six Sigma Project Manager
 -
Six Sigma Templates, Statistics Tables, and Six Sigma Calculators
Aug 16, 21 01:25 PM
Six Sigma Templates, Tables, and Calculators. MTBF, MTTR, A3, EOQ, 5S, 5 WHY, DPMO, FMEA, SIPOC, RTY, DMAIC Contract, OEE, Value Stream Map, Pugh Matrix -
Six Sigma, Six Sigma Training, Courses, Calculators, Certification
Aug 15, 21 10:27 PM
 One site with the most common Six Sigma material, videos, examples, calculators, courses, and certification.

Site Membership
LEARN MORE
Six Sigma
Templates, Tables & Calculators
Six Sigma Slides
Green Belt Program (1,000+ Slides)
Basic Statistics
Cost of Quality
SPC
Control Charts
Process Mapping
Capability Studies
MSA
SIPOC
Cause & Effect Matrix
FMEA
Multivariate Analysis
Central Limit Theorem
Confidence Intervals
Hypothesis Testing
Normality
T Tests
1-Way ANOVA
Chi-Square
Correlation
Regression
Control Plan
Kaizen
MTBF and MTTR
Project Pitfalls
Error Proofing
Z Scores
OEE
Takt Time
Line Balancing
Yield Metrics
Sampling Methods
Data Classification
Practice Exam
... and more