|

 content.")

The low F-statistic of 0.27 says the variation within the appraisers is greater than the variation between them. The F-critical value is 2.81.
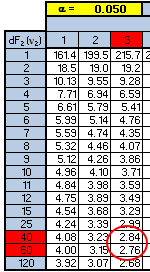
You can use the F-table above to get a close estimate of the F-critical value. One downfall with tables is sometimes the table may not provide a precise number since not every combination is shown. However, the table can provide a fairly good estimate and at least allow a decision to be very conclusive.
The numerator has 3 degrees of freedom and the denominator has 48 degrees of freedom. Using the table below shows that the F-critical value is going to be between 2.76 and 2.84. And in this case, both values are much higher than the F-calculated value of 0.27 so the conclusion is the same.
As a Six Sigma project manager it may be worth re-running (depending on cost and time) the trial with a larger sample size and additional appraiser training to reduce the variation within each one.
The variation is fairly consistent among each of them so it appears there is a systemic issue that is causing nearly similar amounts of variation within each appraiser.
It is possible that one or a few of the widgets are creating the similar spread in the timing for each appraiser. You may examine the timing performance of each widget and run an ANOVA among the 13 widgets and see if one or more stands out.
Epsilon-squared is the % of variation related to the Factor, which is the Appraiser. This is 4.84 / 291.69 = 0.01659 = 1.7%. This is a low value, so it is possible that other Factors exist that are creating the variation.
Practice Exam question
Given the following, find the value of F:
Total Sum of Squares (SS): 25
Between Group SS: 10
N = 5 populations (or appraisers)
Number of observations from each population (appraiser) = 3
Solving:
Total DOF: (5 * 3) -1 = 14
DOF related to "between group" = 4
DOF related to "within group" = 10
The total SS = SS of the "between group" + SS of "within group"
Therefore SS "within group" = 15
Mean Square "between group" = SSbetween / DOFbetween = 10 / 4 = 2.5
Mean Square "within group" = SSwithin / DOFwithin = 15 / 10 = 1.5
F = MSbetween / MSwithin = 2.5 / 1.5 = 1.67
Test your Six Sigma knowledge with this practice exam
Recent Articles
-
Process Capability Indices
Oct 18, 21 09:32 AM
 Determing the process capability indices, Pp, Ppk, Cp, Cpk, Cpm
 -
Six Sigma Calculator, Statistics Tables, and Six Sigma Templates
Sep 14, 21 09:19 AM
 Six Sigma Calculators, Statistics Tables, and Six Sigma Templates to make your job easier as a Six Sigma Project Manager
 -
Six Sigma Templates, Statistics Tables, and Six Sigma Calculators
Aug 16, 21 01:25 PM
Six Sigma Templates, Tables, and Calculators. MTBF, MTTR, A3, EOQ, 5S, 5 WHY, DPMO, FMEA, SIPOC, RTY, DMAIC Contract, OEE, Value Stream Map, Pugh Matrix -
Six Sigma, Six Sigma Training, Courses, Calculators, Certification
Aug 15, 21 10:27 PM
 One site with the most common Six Sigma material, videos, examples, calculators, courses, and certification.

Site Membership
LEARN MORE
Six Sigma
Templates, Tables & Calculators
Six Sigma Slides
Green Belt Program (1,000+ Slides)
Basic Statistics
Cost of Quality
SPC
Control Charts
Process Mapping
Capability Studies
MSA
SIPOC
Cause & Effect Matrix
FMEA
Multivariate Analysis
Central Limit Theorem
Confidence Intervals
Hypothesis Testing
Normality
T Tests
1-Way ANOVA
Chi-Square
Correlation
Regression
Control Plan
Kaizen
MTBF and MTTR
Project Pitfalls
Error Proofing
Z Scores
OEE
Takt Time
Line Balancing
Yield Metrics
Sampling Methods
Data Classification
Practice Exam
... and more