|

 content.")
t-test or z-test?
Choosing the correct hypothesis test is can be tricky as a new Six Sigma Green Belt or Black Belt.
The t-test, (aka Student's t-distribution) is used to estimate the parameters of a population when the sample size is small.
The t-test is generally used when:
- Sample sizes less than 30 (n<30)
- Standard deviation is UNKNOWN
There are several flowcharts and videos to help you determine the correct path. The assumption of normality is important to understand if you find your data to be non-normal. It may be possible to apply parametric tests even if your data is non-normal.
Two of the more common tests used are the t-test and z-test which begin to look similar as the sample size increase and represents more of the population. Visit the t-distribution for more insight.
T-tests are commonly used in Six Sigma projects as a hypothesis test for determining if:
- One mean from random sample is different than a target value. (One sample t)
- Two group means are different. (Two sample t)
- Paired means are different. Such as a Before and After study of the same process or workers. (Paired t)
The word different could be greater than, less than, or a certain value different than a target value. You can run statistical test in software usually be easily configuring the parameters to look for certain types of differences as were just mentioned.
For example, instead of just testing to see if one group mean is different than another, you can test to see if one group is a greater than the other and by a certain amount. You can get more information by adding more specific criteria to your test.
PRACTICE QUESTIONS:
1) A Green Belt wants to evaluate the output of a process before and after a set of changes were made to increase the productivity. The data acquired meets the assumption of normality. Which hypothesis test is best suited to determine if the changes actually improved the productivity?
A) Paired-t test
B) Two sample t test
C) ANOVA
D) F-test
Answer: A
2) If a Black Belt wants to test if a supplier can produce a batch of parts in less than 5 business days, which t test would be used?
A) One sample t test
B) Two sample t test
C) Paired sample t test
Answer: A, and a one-tailed test.
3) If a Black Belt wants to test the productivity of two machines in terms of pieces/hour and determine whether there is a difference, which test should be used?
A) One sample t test
B) Two sample t test
C) Paired sample t test
Answer: B, and a two-tailed test.
EXAMPLE:
A study of frisbees is being done to determine if the diameter is being manufactured at 14.5 inches in diameter. Whether they are less than 14.5 inches is not important. However it is important to know whether or not the mean is greater than 14.5 inches. A sample of 49 frisbees is reviewed and the mean diameter is 14.75 inches with a standard deviation of 0.30 inches. The data meets the assumptions of normality. Test at a 95% Confidence Level.
1) Which hypothesis test should be used? 1 sample t
2) What is HO? Mean = 14.5 inches
3) What is HA? Mean > 14.5 inches
4) What is value of alpha-risk? 0.05
5) What is n? 49
6) Is this a 1 or 2 tailed test? 1-tailed
7) Therefore, what is Zα ? 1.64
8) What is the test statistic (x-bar)? 14.75 inches
9) What is t-calculated? μo + Zα * (σ/√n)
14.75 + (1.64)(0.30 / √49) = 14.75 + (1.64)(0.0428571) = 14.75 + 0.07 = 14.82 inches
10) Since the test statistic is 14.75 inches and the calculated statistic is 14.82 inches, the null hypothesis is inferred that the mean of the population is equal to 14.75 inches.
Looking for more practice certification questions to test your knowledge? Click here to purchase a practice exam with over 180 practice questions and explanations.
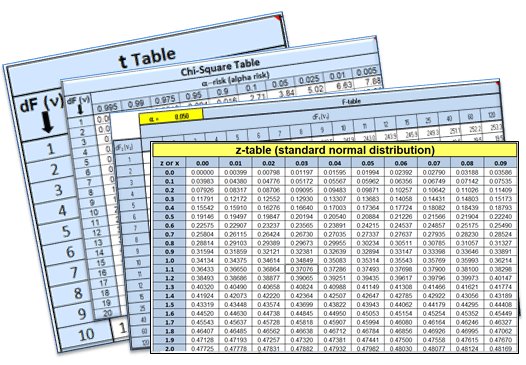
Statistics Tables
Recent Articles
-
Process Capability Indices
Oct 18, 21 09:32 AM
 Determing the process capability indices, Pp, Ppk, Cp, Cpk, Cpm
 -
Six Sigma Calculator, Statistics Tables, and Six Sigma Templates
Sep 14, 21 09:19 AM
 Six Sigma Calculators, Statistics Tables, and Six Sigma Templates to make your job easier as a Six Sigma Project Manager
 -
Six Sigma Templates, Statistics Tables, and Six Sigma Calculators
Aug 16, 21 01:25 PM
Six Sigma Templates, Tables, and Calculators. MTBF, MTTR, A3, EOQ, 5S, 5 WHY, DPMO, FMEA, SIPOC, RTY, DMAIC Contract, OEE, Value Stream Map, Pugh Matrix -
Six Sigma, Six Sigma Training, Courses, Calculators, Certification
Aug 15, 21 10:27 PM
 One site with the most common Six Sigma material, videos, examples, calculators, courses, and certification.

Site Membership
LEARN MORE
Six Sigma
Templates, Tables & Calculators
Six Sigma Slides
Green Belt Program (1,000+ Slides)
Basic Statistics
Cost of Quality
SPC
Control Charts
Process Mapping
Capability Studies
MSA
SIPOC
Cause & Effect Matrix
FMEA
Multivariate Analysis
Central Limit Theorem
Confidence Intervals
Hypothesis Testing
Normality
T Tests
1-Way ANOVA
Chi-Square
Correlation
Regression
Control Plan
Kaizen
MTBF and MTTR
Project Pitfalls
Error Proofing
Z Scores
OEE
Takt Time
Line Balancing
Yield Metrics
Sampling Methods
Data Classification
Practice Exam
... and more