TPM
Total Productive Maintenance
Total Productive Maintenance (TPM) is implemented as part of the IMPROVE phase in a DMAIC Six Sigma project. A program requires participation from all levels of an organization.
The purpose:
- Address root causes that reduce the capacity of equipment
- Keep equipment operating precisely and consistently to make acceptable parts
- Develop operator skills to "own" the machine and routine maintenance
TPM is not a:
- headcount reduction initiative
- traditional maintenance program
- cost reduction program

More specifically, its purpose is to control the inputs (to allow stable output) in projects where the process is dependent on:
As you recall, these are the three factors that make up OEE, Overall Equipment Effectiveness. OEE is often used as a lagging (reactive) indicator metric to gauge a TPM program.
TPM is a critical principle within Lean manufacturing. If machine uptime (availability) is not predictable and product cannot flow smoothly and reliably then there will be excess inventory, and buffers must be kept to protect the customer.
Excess inventory is waste. Inventory ties up cash, takes up space, and may have a shelf life.
Preventing UNPLANNED downtime is important and there are many tools such as NVH monitoring, infrared image surveying, ultrasonic tests, that can predict failures before they actually occur to keep machines "available" when they are needed.
A robust preventive maintenance program is also key to a TPM program. Tracking and executing according to the PM manuals are inputs to preventing unplanned downtime and quality defects. Similar to regular oil changes and tire rotations on a vehicle.
It is critical that the users of the machines (operators) be involved in the TPM process. Maintenance departments should handle the major items, but operators and regular users should have input and routine tasks and responsibility to achieve continuously improving OEE.
The TPM status should be visual. Visual Management is another component in Lean Manufacturing. Computers, graphic charts, statistics are not necessary either.
Although they have a time and place, visual management can be done with handwritten charts, dry erase boards, magnets, and cards (such as Kanban cards). For example, hours on a machine can be handwritten and the next due date, then it is easily visible the status of the PM for that machine.
6 Major Losses within TPM
Breakdown Losses
Sudden, dramatic or unexpected equipment failures that makes the machine less available. Contributing factors include:
- Major mechanical failures
- Electrical system failures
- Structural failure
Set-up & Adjustment Losses
Downtime and defective product that occurs when production of one part ends and the equipment is set-up/adjusted to meet the requirements of another part. The degree of loss depends on factors such as:
- Process standards
- Maintenance level of equipment
- Tooling consistency and quality
- Operator skill level
- Machine to machine standardization
Idling & Minor Stoppages
Production is interrupted by a temporary malfunction or when the machine is idling. Contributing factors include:
- Defective products that result in line shut line down
- Disruption of production flow, lack of product or raw material, tools
- Dependence on assembly components or other inputs
- Operator on other machine or other tasks
- Temporary equipment malfunction
Start Up Losses
Yield losses that occur during the early stages of production - from machine start-up, warm-up, "learning phase" to the point where it is making regular, quality production. The degree of loss depends on factors such as:
- Maintenance of equipment
- Tooling
- Raw Material
- Operator skill level
Reduced Speed Losses
Refers to the difference between equipment design speed and the actual operating speed. Some parts may not be able to run at a machines maximum rate (for example, machine can run large ranges of parts and larger parts may have to run slower per the OEM manual - so an ideal rate for each part should be established). Factors include:
- Mechanical problems
- Risk of making unacceptable parts at higher speeds
- Operator training
Quality
Defects (Scrap & Rework)
Losses in quality caused by malfunctioning equipment or tooling. The degree of loss depends on factors such as:
- Maintenance of equipment
- Tooling
- Raw Material
- Operator skill level or adherence to SOP's
Autonomous Maintenance
Autonomous Maintenance means that operators and indirect personnel have a participating role in maintaining equipment. There are seven steps to follow:
1) Inspect and Clean
- Clean grease, oil, and dirt. Lubricate, tighten bolts, connections, hoses, etc.
2) Eliminate Sources of Dirt/Grease
- Correct sources of dirt and grime; prevent spattering and improve
- Accessibility for cleaning and lubrication. Reduce the time to clean and lubricate.
3) Create Cleaning & Lubrication Standards
- Write standards that will ensure cleaning, lubrication, and tightening can be done efficiently and done at regular planned intervals.
4) Conduct General Inspection Training
- Conduct skills training with inspection manuals and use general inspections to find and correct slight abnormalities in equipment. Use visual gauges and if possible, those that give feedback signals such as an alarm or light.
5) Conduct Autonomous Inspections
- Prepare standard checklists for autonomous inspections and defined intervals for the inspections.
6) Create Workplace Organization and Standards
- Standardize and visually manage the work processes. Create visual work instructions for the steps above.
7) Implement Autonomous Maintenance
- Develop policies and objectives that make improvement activities part of daily routing. Maintain reliable data and use it to continuously improve. Involve the operators in the development of the above steps, they will feel a higher degree of ownership in sustaining the program. In the long term. Ensure the operators have a stake in the program with routine tasks and responsibilities.
Facility Maintenance Metrics
Mean Time Between Failures (MTBF)
The Mean Time Between Failures (MTBF) is the average time between each failure.
Some of the variables to iron out before applying is the definition for "uptime". A machine running at a fraction of its intended performance is likely not acceptable to be considered "uptime". Whatever decision is made, ensure that is applied consistently across all pieces of equipment.
What exactly is a "failure"?
A complete stoppage is one more obvious answer. Some may also consider a "failure" once the item or equipment experiences a slowdowns or reduced performance from an ideal level, but don't actually stop the machine. Again, whatever the definition is for failure, it should be uniformly applied to all pieces of equipment.
MTBF = (Total uptime) / (number of failures)
There are some items that are not repairable, but they are replaced. Such examples are light bulbs, switches, torn belts. In such cases, the term Mean Time To Failure (MTTF) is used.
There is also the debate of planned downtime. Robust TPM programs have planned downtime for maintenance and predictive tools may create planned replacements or repairs in effort to reduce unplanned downtime and variability in uptime performance.
Ideally, the higher the MTBF the better. However, it is likely to plateau at a certain point due to planned downtime and intended maintenance.
Don't give up there. The next challenge becomes reducing the planned outages and get better life out of the components or items involved so these planned intervals can be expanded.
Mean Time To Repair (MTTR)
The Mean Time To Repair is the average time to repair something after a failure. As above, it's important to clarify exactly what constitutes a failure and downtime vs uptime.
"Uptime" at a significantly compromised rate of production due to poor maintenance is usually not acceptable. Allowing this to continue can show a better MTBF than the story in its entirety should show.
Mean Time To Repair = (Total downtime) / (number of failures)
The MTTR puts an emphasis on Predictive and Preventive Maintenance. Better preparation, spare parts programs, predictive analysis, are methods to reduce the MTTR.
Not all repairs are equal. What constitutes an acceptable repair?
This should be defined in the definition of a failure as well. The machine should not only be "up", but it should be up to a certain level of sustained performance before the time can be counted as "uptime".
The GB/BB should help (allow a team member to be the author) develop a Standard Operating Procedure or a Work Instruction to clearly define the variable and metrics. As part of the CONTROL phase this is the type of deliverable that would be expected from the Six Sigma Project Manager.
MTBF and MTTR Example
MTBF
Given that over a period of time the following information is available:
Total Production Time (PT): 1,240 minutes
Total Downtime (DT): 1.5 hours (watch the unit of measures)
Number of Failures (F): 25
Determine the MTBF:
The first step is to determine the Uptime (UT) which = PT - DT
Uptime (UT) = 1,240 minutes - 90 minutes = 1,150 minutes
MTBF = UT/F = 1,150 / 25 = 46 minutes
There is another method to represent MBTF which equate to the same result.
MTBF = 1 / Failure Rate
where
Failure Rate = the # of failures divided by the total uptime = F / UT
The Failure Rate = 25 / 1,150 minutes = 0.02174 Failures / Minute
The inverse of the Failure Rate = MTBF = 46 minutes
MTTR
Using the same information from above, determine the MTTR:
MTTR = Total Downtime / # of Failures = 90 / 25 = 3.6 minutes
NOTES:
As a GB/BB, you should examine the data in its entirety. Perhaps the mean does not represent the measure of central tendency.
Examine every time interval between failure for MTBF. Each amount of time between each failure is one data point. For MTTR, analyze the amount of time it took for a repair. Each time to repair is one data point.
- If the data set is normal, then apply the mean.
- If the data set is not normal, then the median or mode may be more appropriate.
Just as important is look for outliers.
When studying the data you may find outliers such as a period of time that was unusually long or short between failures or repair times that were extremely quick or took unusually long. Perhaps the team can brainstorm the causes using the 5-WHY.
- Was the repair done differently?
- Was the repair done be a different person or group of people?
- Was a different part(s) used?
This can shed light on best practices or components that should be used again for a closer Design of Experiments (DOE) to find the optimal combination or best procedure.
It may be worth spending a little more money up front to use quality parts or perform a longer PM to save more time in the long run. Perhaps, a minor increase in the MTTR equates in a significant increase in MTBF. The team will have to determine if this is acceptable.
Remember the goal of Six Sigma, is not just to shift the mean to a more favorable outcome, but to make the performance more reliable and predictable.....in other words with minimal variation (consistency)!
IATF 16949: 2016
TPM has an increasing role in this international automotive standard as noted in Section 8.5.1.5. The intention is to strengthen the requirement for equipment maintenance and overall proactive management.
A requirement involves tracking TPM and usually metrics such as OEE, MTBF, and MTTR are applied. The results of these metrics are inputs to the Management Review section, 9.3
MTBF and MTTR Calculator
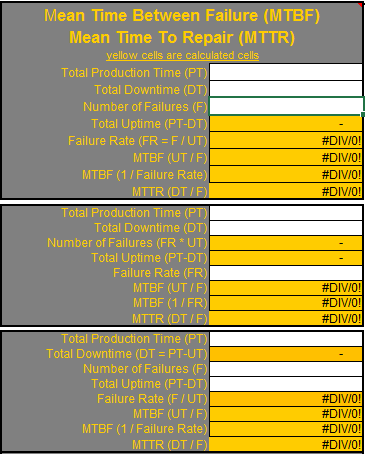 |
This calculator, and others including OEE, are available tools to help Six Sigma/Lean Project Managers. The downloads are in a .zip format. A extractor such as WinZip is required to unzip the package. Click here to see them all. |
How does this relate to OEE?
Recall that OEE is made up of the product of:
Performance * Availability * Quality
Availability is the amount of time the machine is available to run as scheduled.
Availability is the unit of time the machine is available to run divided by the total possible available time. This metric does not include any performance numbers relative to how the machine runs while it is running.
AVAILABILITY = Operating Time / Planned Production Time
A 30 minute scheduled interval to replace a belt is much better than a 40 minute unscheduled interval to replace a torn belt that could tear and rip apart an oil line or result in other unintended consequences.
Assuming the belt replacement has been studied and the proper interval for useful life has been predicted (in other words, not over-changing and spending too much money and time or excess belt replacements), then a scheduled event is obviously more predictable and favorable then hoping and not knowing when the next failure will take place.
A scheduled event such as a PM, break, safety meeting, Gemba walk, is NOT in the denominator and does not penalize the metric of AVAILABILITY.
Again, the team should also try to minimize these "planned" events to try and get the machine(s) more time to be utilized. But this affect Utilization which is different than the metric of AVAILABILITY (go to the OEE page to learn more).
As related to the metrics above:
AVAILABILITY = MTBF / (MTBF + MTTR) for Planned Production Time
An unscheduled belt change would be in the figure of Planned Production Time; however, a scheduled period of downtime (again the schedule downtime should be minimal and strategically determined) would not be in this figure of Planned Production Time.
Templates, Statistics Tables, and Calculators
Click here to review options to access entire site
Return to the Six-Sigma-Material Home Page
Recent Articles
-
Process Capability Indices
Oct 18, 21 09:32 AM
 Determing the process capability indices, Pp, Ppk, Cp, Cpk, Cpm
 -
Six Sigma Calculator, Statistics Tables, and Six Sigma Templates
Sep 14, 21 09:19 AM
 Six Sigma Calculators, Statistics Tables, and Six Sigma Templates to make your job easier as a Six Sigma Project Manager
 -
Six Sigma Templates, Statistics Tables, and Six Sigma Calculators
Aug 16, 21 01:25 PM
Six Sigma Templates, Tables, and Calculators. MTBF, MTTR, A3, EOQ, 5S, 5 WHY, DPMO, FMEA, SIPOC, RTY, DMAIC Contract, OEE, Value Stream Map, Pugh Matrix


Site Membership
Click for a Password
to access entire site
Six Sigma
Templates & Calculators

Six Sigma Modules
The following are available
Click Here
Green Belt Program (1,000+ Slides)
Basic Statistics
Cost of Quality
SPC
Process Mapping
Capability Studies
MSA
Cause & Effect Matrix
FMEA
Multivariate Analysis
Central Limit Theorem
Confidence Intervals
Hypothesis Testing
T Tests
1-Way ANOVA
Chi-Square
Correlation and Regression
Control Plan
Kaizen
MTBF and MTTR
Project Pitfalls
Error Proofing
Effective Meetings
OEE
Takt Time
Line Balancing
Practice Exam
... and more