|

 content.")
Measures of Dispersion
The measures of dispersion describe the width of the distribution. The results for the measures of dispersion are calculated below for the data set shown below.
{1, 3, 8, 3, 7, 11, 8, 3, 9, 10}
Range
The range, R, of the data is the difference of the highest and smallest values.
R = 11 - 1 = 10
Deviation
The deviation is the difference of each value from the mean. This is used in the calculation of the standard deviation and variance. "x" is the point of interest.
The sum of deviations from the mean is always zero.

Standard Deviation
The standard deviation is shown by the following formulas. It also equals the square root of the variance. "x" is the point of interest.
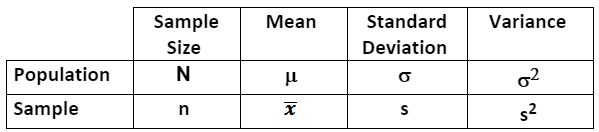
"N" and "n" represent the sample size, although one is capitalized it is done for notation, they both represent the same value (the sample size).
As the sample size approaches infinity, the denominators in both formulas become equal. The "n-1" is to remove bias from very small sample sizes such as less than 30 samples.

Variance
The variance is the standard deviation squared. The variance can not be calculated unless it is known that the data being analyzed is from a Population or Sample. This will change the denominator value. As the sample size approaches infinity, this difference in the values ("N" or "n-1") becomes negligible.
A term called "degrees of freedom (dF)" is commonly found in statistics. This refers to the number of independent values. For example, in the denominator of the standard deviation and variance formula is a value of "n-1".
This is also known as the number of degrees of freedom. If a particular sample size has 15 values then n = 15.
If 14 of the 15 values are known and the value of X-bar (sample mean) is known, then it is possible to calculate the final unknown value in the sample set.

Variance example
Data Set Analysis
The table shown below is a numerical summary of the measures of central tendency and dispersion for the data set shown at the top of the page.

Coefficient of Variation
The coefficient of variation is the ratio of the standard deviation to the mean. This value is expressed as a percentage and helps to determine comparing variability when mean is also known.
This is not the same as Covariance.
For example:
Comparing variability is stocks, machines, operators, and shifts, commonly use the coefficient of variation.
If we only know the standard deviation of the performance on 5 machines it may not be satisfactory to make a good decision if stability is most important. Then you are interested in the mean and how much variability from the mean the machines exhibit.
If it is known that all machines have a standard deviation of 2 pieces/hour, which one is worse assuming you want stability and predictability?
The correct answer is the machine with the highest mean pieces/hour has less risk and is more predictable to generate consistent performance.
This measurement is commonly used to assess risk among stocks for risk-return. The mean is the "expected return".
The formula is shown below:
 Population Coefficient of Variation
EXAMPLE:
Stock 1: Mean = $36.50 and Standard Deviation = $2.00
Stock 2: Mean = $60.00 and Standard Deviation = $4.00
Stock 3: Mean = $45.00 and Standard Deviation = $2.25
THEN
CV 1: 5.48%
CV 2: 6.67%
CV 3: 5.00%
CONCLUSION:
Although the standard deviation is less for Stock 1, the stock is riskier and predicted to have more volatility in performance.
STOCK 3 has lowest risk of the three stocks.
EXAMPLE 2:
Calculate the CoV for 250 samples that had a mean of 10 and standard deviation of 5.
% CoV = (5/10) * 100 = 50%
The table below summarizes notation for describing samples and populations.
Samples are properly described as statistics.
Populations are properly described as parameters.
Another Example using Excel

Showing the Formulas
Excel uses "n-1" in the denominator to calculate the sample statistics for the measures of dispersion and central tendency (the rows in Excel for the data were in rows 3-16).


Templates, Tables, and Calculators
Return to Six-Sigma-Material Home Page
Recent Articles
-
Process Capability Indices
Oct 18, 21 09:32 AM
 Determing the process capability indices, Pp, Ppk, Cp, Cpk, Cpm
 -
Six Sigma Calculator, Statistics Tables, and Six Sigma Templates
Sep 14, 21 09:19 AM
 Six Sigma Calculators, Statistics Tables, and Six Sigma Templates to make your job easier as a Six Sigma Project Manager
 -
Six Sigma Templates, Statistics Tables, and Six Sigma Calculators
Aug 16, 21 01:25 PM
Six Sigma Templates, Tables, and Calculators. MTBF, MTTR, A3, EOQ, 5S, 5 WHY, DPMO, FMEA, SIPOC, RTY, DMAIC Contract, OEE, Value Stream Map, Pugh Matrix -
Six Sigma, Six Sigma Training, Courses, Calculators, Certification
Aug 15, 21 10:27 PM
 One site with the most common Six Sigma material, videos, examples, calculators, courses, and certification.

Site Membership
LEARN MORE
Six Sigma
Templates, Tables & Calculators
Six Sigma Slides
Green Belt Program (1,000+ Slides)
Basic Statistics
Cost of Quality
SPC
Control Charts
Process Mapping
Capability Studies
MSA
SIPOC
Cause & Effect Matrix
FMEA
Multivariate Analysis
Central Limit Theorem
Confidence Intervals
Hypothesis Testing
Normality
T Tests
1-Way ANOVA
Chi-Square
Correlation
Regression
Control Plan
Kaizen
MTBF and MTTR
Project Pitfalls
Error Proofing
Z Scores
OEE
Takt Time
Line Balancing
Yield Metrics
Sampling Methods
Data Classification
Practice Exam
... and more