|

 content.")
Members Home PageWelcome
 |
This is the Members home page. Upon login you will be directed to this page as your starting point. You have access to all the protected (and unprotected) content throughout this website. If you would like help finding information on a particular topic use the SEARCH feature or contact us at sixsigmamaterial@gmail.com |
DMAIC
Start by clicking on a phase below. Scroll through and find the various topics and tools associated with a phase.
 |
 |
 |
 |
 |
Practice Questions
TRUE or FALSE: A Scatter Plot is a visual tool used often in a Regression and Correlation analysis which shows the relationship between one X variable (input) and one Y (output) variable?
What is the baseline z-score?
A Six Sigma Black Belt has compiled the following information regarding computer chips for a DMAIC project and wants to determine the baseline sigma score in the MEASURE phase.
- There a 7 defect types in each computer chip
- 17,500 computer chips were analyzed, 10,650 had one or more defects
- 19,207 total defects were found among the 17,500 chips
DPU = 19,207 / 17,500 = 1.0975
DPO = 19,207 / (17,500 * 7) = 0.156792
DPMO = DPO * 1,000,000 = 156,792
TPY = 1 - DPO = 1 - 0.156792 = 0.843208 = 84.3208%
Z-score (sigma score) = NORM.S.INV(TPY) + 1.5 (sigma shift) = NORM.S.INV(0.843208) + 1.5 = 1.0077 + 1.5 = 2.5077
Calculate the sample size required for a discrete (binomial) proportion estimation with an unknown population. Given:
z = 1.645 for a confidence level (α) of 90%.
p-bar = 0.5
E = 2% = 0.02
Therefore, solving for the sample size
n = 1.6452 * 0.5 * (1 - 0.5) / 0.022
n = 0.6765062 / 0.0004 = 1691.27 (always round up)
n = 1692. A minimum of 1,692 samples are needed.
If you wanted a confidence level of 95%, the z-score is 1.96 and n becomes 2,401 samples.
Click here to learn more about calculating sample sizes for various types of data.
A common use of the student t-test is to detect a difference (or not) in
1) Means
2) Variation
3) Degrees of Freedom
4) Power
Answer: Visit T-Test Module for the answer and more insight
To further test your Lean Six Sigma knowledge and prepare for your certification exam, you will find 180+ questions by clicking here.
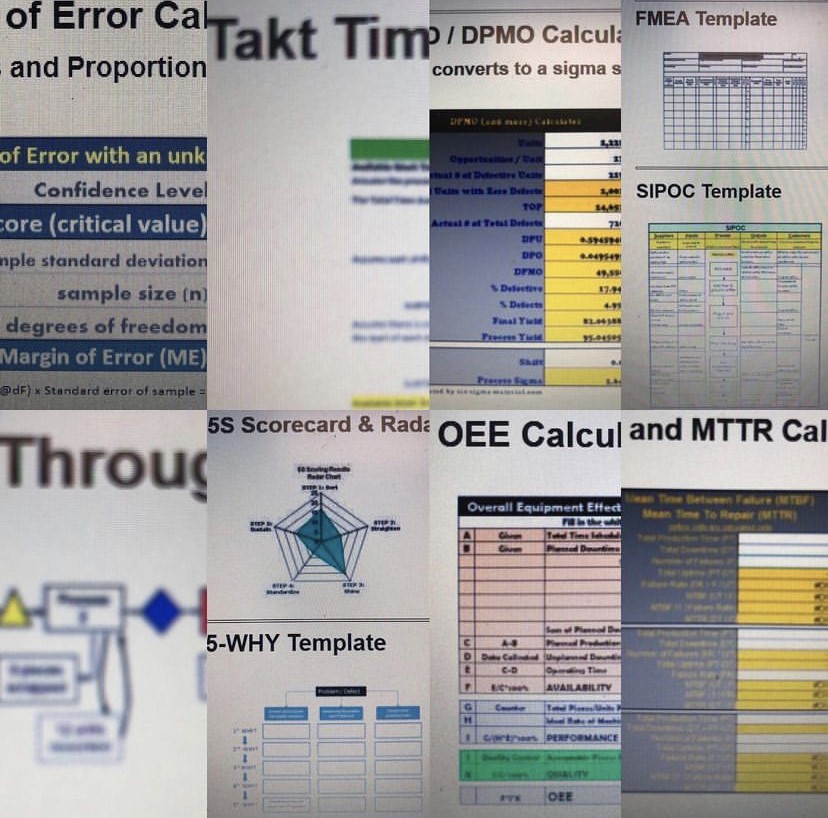
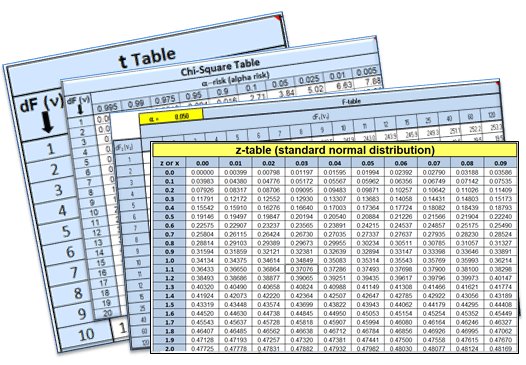
Templates, Tables, & Calculators (click on image)
New - Free Downloads
 |
Click on the 'Members Offers' link along the top of this page to view offers and material available to download. |
Are you ready to test your knowledge?
180+ questions to prepare aspiring Green Belts and Blacks Belts for a Six Sigma DMAIC certification exam for $9.99.
These questions cover topics of Lean Manufacturing, Six Sigma, and Project Management. All will be covered on a certification exam. Questions come with explanations and links for additional review and research.

Message: Be careful for bias in sampling
A goal of the Six Sigma project manager, in the MEASURE phase, is to recognize potential bias in the data (or responses) and prevent it from coming into play if possible. Forms of bias that can be introduced into the sampling strategy are:
- Convenience Bias: Often found when time or money is serious constraint and sampling only done when it is convenient.
- Non response Bias: When a response is needed according to the sampling strategy but the response is incomplete or not provided at all.
- Response Bias: Occurs when response is misleading, inaccurate or untruthful. occurs when the responder feels pressure that occurs during data collection and influences the response (i.e. social pressure to be accepted and avoid conflict).
- Voluntary Response Bias: when sample members are self-selected volunteers or when the responders (often people) can choose whether to participate. The resulting sample tends to overrepresent individuals who have strong opinions.
Recent Articles
-
Process Capability Indices
Oct 18, 21 09:32 AM
 Determing the process capability indices, Pp, Ppk, Cp, Cpk, Cpm
 -
Six Sigma Calculator, Statistics Tables, and Six Sigma Templates
Sep 14, 21 09:19 AM
 Six Sigma Calculators, Statistics Tables, and Six Sigma Templates to make your job easier as a Six Sigma Project Manager
 -
Six Sigma Templates, Statistics Tables, and Six Sigma Calculators
Aug 16, 21 01:25 PM
Six Sigma Templates, Tables, and Calculators. MTBF, MTTR, A3, EOQ, 5S, 5 WHY, DPMO, FMEA, SIPOC, RTY, DMAIC Contract, OEE, Value Stream Map, Pugh Matrix -
Six Sigma, Six Sigma Training, Courses, Calculators, Certification
Aug 15, 21 10:27 PM
 One site with the most common Six Sigma material, videos, examples, calculators, courses, and certification.

Site Membership
LEARN MORE
Six Sigma
Templates, Tables & Calculators
Six Sigma Slides
Green Belt Program (1,000+ Slides)
Basic Statistics
Cost of Quality
SPC
Process Mapping
Capability Studies
MSA
SIPOC
Cause & Effect Matrix
FMEA
Multivariate Analysis
Central Limit Theorem
Confidence Intervals
Hypothesis Testing
T Tests
1-Way ANOVA
Chi-Square
Correlation
Regression
Control Plan
Kaizen
MTBF and MTTR
Project Pitfalls
Error Proofing
Z Scores
OEE
Takt Time
Line Balancing
Yield Metrics
Sampling Methods
Data Classification
Practice Exam
... and more
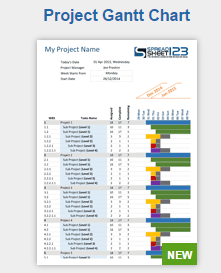
Need a Gantt Chart?