
Voice of the Customer (VOC)
Description:
The Voice of the Customer (VOC) are the customer specifications and requirements. This can include variables type of data such as the:
The customer may specify only one specification limit (such as the LSL or the USL). The customer may or may not specify a target value. And the target value is not necessarily the midpoint of the specifications.
Don't assume any of the customer specifications. Ask the customer for the specifications. The VOC may also involve attribute specifications such as a "number of ...", color type, or a PPM rating.
This may also include information such as nominal information which could be colors, types of materials, or other features where numbers aren't applicable.
Objective:
The team must successfully obtain the needs (specifications) of customers. It is imperative to know who they are first before analyzing any numbers. Some will be obvious due to history and others are unknown but avoid making assumptions.
Take nothing for granted during this research. Spending ample time obtaining the information along with their specification and perception of quality is often the most difficult of this phase.
Some customers may have very specific needs that conflict with other customers or some needs may be to specifically meet the needs of one or a few people at a customer’s company.
Understanding these needs at that level of detail is necessary to guide the team in the right direction. Proper time spent on this step will avoid targeting wrong or lower importance needs of the customer.
The Voice of the Customer will provide the upper specification limit and/or lower specification limit and/or a target for each CTQ (requirements in the CTQ Flowdown and SIPOC.
This information is also used in the DFSS (DMADV) methodology using the Kano Model and Pugh Matrix.
IMPORTANT:
The VOC provides specification limits (i.e. LSL, USL). This is NOT the same as the Voice of the Process (VOP) which provides the process control limits (LCL, UCL).
The VOP describes the width of the data and can change with every new data point, in other words the LCL and UCL are formulas whose values are changing to describe the process behavior.
The specification limits (provided by the VOC) are constants, unless the customer informs of a change. The VOC will be referenced and verified throughout the project and ultimately at the closing of the project and hand-off to the Process Owner.
Visual Aid of VOC vs VOP
What conclusions can be drawn from the figures below?
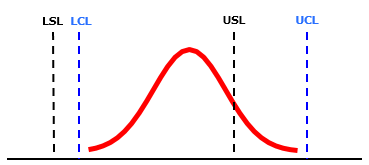
The figure above shows that the process is not meeting the customer specifications. Even if the process is in control, it does not mean that it is meeting the Voice of the Customer (VOC). It appears that a shift toward the LSL would help to reduce the non-conformances that are occurring above the USL.
The Voice of the Customer is the space between the LSL and the USL. The Voice of the Process (VOP) is the red bell curve line.
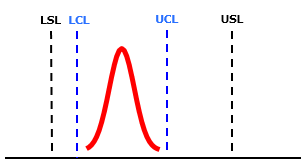
The figure above shows that the process is meeting customer specifications. The VOP is within the VOC.
Compared to the top figure, this distribution is more precise and more accurate (assuming the customer target is the midpoint between the LSL and USL).
In a situation like this, it may be possible that too much money and resources are being dedicated to maintaining this tight of a process. It all depends on the risk of non-conforming and whether competition is meeting the VOC although with less control but yet good enough at a lower price.
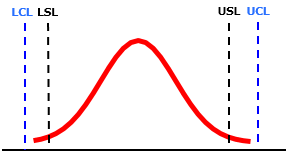
The figure above shows the process is meeting customer specifications most of the time. However, there will be instances when the process exceeds the USL and is below the LSL which are non-conformance. In other words, the VOP extends beyond the boundaries of the VOC.
Again, assuming the customer target is the midpoint between the LSL and USL, this is a process that is ACCURATE; however, it is NOT PRECISE.
In a situation like this, the team should be encouraged that the process variation is all that needs improving. The mean is acceptable for as long as improvements to reduce the variation do not affect it.

Sources for the VOC
Gemba
Go and observe Customer needs, wishes, desires, mandates, attitudes. Customer needs are dynamic. Keeping up with trends and predicting behaviors separates the best products, processes, and services.
Although it is very important for any Six Sigma project, it is especially important when developing an unprecedented product or process in a DFSS project. While being practical and sensible, the more customer feedback, the better.
Be cautious on the approach and strategy, delicately balancing the team's desire to obtain all possible information without annoying the customer, leaking a potential competitive edge, or tying up too many resources.
Categorizing the customer needs is done by using an Affinity Diagram and prioritizing them is done using Quality Function Deployment.
Templates, Tables, and Calculators
Browse active job openings related to Six Sigma
Return to the Six-Sigma-Material Home Page
Recent Articles
-
Process Capability Indices
Oct 18, 21 09:32 AM
 Determing the process capability indices, Pp, Ppk, Cp, Cpk, Cpm
 -
Six Sigma Calculator, Statistics Tables, and Six Sigma Templates
Sep 14, 21 09:19 AM
 Six Sigma Calculators, Statistics Tables, and Six Sigma Templates to make your job easier as a Six Sigma Project Manager
 -
Six Sigma Templates, Statistics Tables, and Six Sigma Calculators
Aug 16, 21 01:25 PM
Six Sigma Templates, Tables, and Calculators. MTBF, MTTR, A3, EOQ, 5S, 5 WHY, DPMO, FMEA, SIPOC, RTY, DMAIC Contract, OEE, Value Stream Map, Pugh Matrix


Site Membership
Click for a Password
to access entire site
Six Sigma
Templates & Calculators

Six Sigma Modules
The following are available
Click Here
Green Belt Program (1,000+ Slides)
Basic Statistics
Cost of Quality
SPC
Process Mapping
Capability Studies
MSA
Cause & Effect Matrix
FMEA
Multivariate Analysis
Central Limit Theorem
Confidence Intervals
Hypothesis Testing
T Tests
1-Way ANOVA
Chi-Square
Correlation and Regression
Control Plan
Kaizen
MTBF and MTTR
Project Pitfalls
Error Proofing
Effective Meetings
OEE
Takt Time
Line Balancing
Practice Exam
... and more