SIPOC
Suppliers-Inputs-Process-Outputs-Customers
Description:
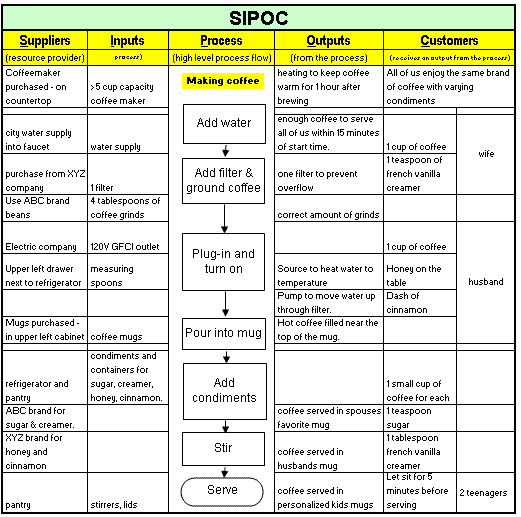
A SIPOC is a high-level process map with (ideally) 4-7 process steps used in the Define Phase of a DMAIC project. It should indicate only major processes, activities, and tasks. The scope should be evident with the start of the process being at the top of the form and the end of the process at the bottom.
Objective:
Ensure the team members understand the project boundaries with a clear start of the process and end of the process that matches the scope defined in the project contract.
Team members should understand that items external to the scope are important BUT they are not included in this project OR it is negotiated in with approval of upper management and steering committee. These external process steps may make the project too large or can form the beginning of a new project.
All of the basic processes are listed with the inputs and outputs, from where and to where. The team should have common agreement on the suppliers, inputs, process, outputs, and customers by the end of this exercise.
Completing the SIPOC form
Follow these general guidelines to complete the SIPOC:
- List the process steps as they occur now from top under the "P" column. At the top is the start of process leading to the bottom to the final process step. Avoid devoting excess time in adding detail, the Detailed Process Mapping exercise in the MEASURE phase will provide this detail. Given the scope of the project, the first process step should be defined as the start of the process just as spelled out in the project contract. The bottom process, should be the end of the project that this project is interested in.
- Under the "O" column, list all the Outputs from each process and any specific requirements of each Output, add more as the customer specifications are clearer through the use of other tools such as Kano Model and Voice of the Customer.
- List all the Suppliers to each process under the "S" column.
- List the Inputs to the process they provide under the "I" column. Add specific requirements needed for each process to occur. Often times the customer is also the supplier of the inputs.
- Identify the Customer(s) in Column C. The customers may be the end-user and your own company. It is important to capture the outputs as they pertain the needs of the Customer. If the project is focused on Performance (one component of OEE), the the output should be pieces produced and time and pcs produced per some unit of time. The Customer may be your own manufacturing plant.
Helpful Hints
As a Green Belt or Black Belt, set a target to complete this form in one team meeting. It does not need to be perfect after the first attempt. It should be shared with others and refined as the customer specifications and input requirements become more refined. It should be complete, understood, and accepted before proceeding to the MEASURE phase.
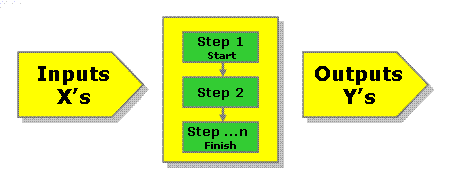
The inputs (X's) are the sources of variation. The variation can result in defects whether it is from a system, gauge, part, or process is to be quantified when doing the Measurement Systems Analysis (MSA).
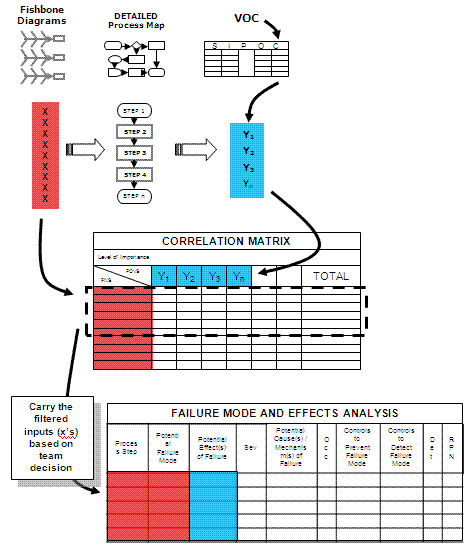
The inputs must be controlled and maintained under control to prevent defects and minimize their effect on the output. Resolving the root causes of the sources of variation is essential to meeting customer targets (output requirements) also known as the Voice of the Customer. The "C" column are the outputs and go along the top row in the Correlation Matrix.
The figure below shows the linkage of this tool to others used in the DMAIC process.
SIPOC Template
A SIPOC template, along with several other templates and calculators with examples, is available by clicking here.
Example of a SIPOC
Creating a SIPOC with Excel
Creating a SIPOC can easily be done using Excel, Word, Sheets, or Docs. Create a grid with 5 columns (S-I-P-O-C) and the rows will be filled in with by the team as the process is added (high level) with the beginning of the process starting at the top of the page.
Subscribe for full site access
Looking for a career in Six Sigma?
Templates, Tables, and Calculators
Return to the Six-Sigma-Material Home Page
Recent Articles
-
Process Capability Indices
Oct 18, 21 09:32 AM
Determing the process capability indices, Pp, Ppk, Cp, Cpk, Cpm -
Six Sigma Calculator, Statistics Tables, and Six Sigma Templates
Sep 14, 21 09:19 AM
Six Sigma Calculators, Statistics Tables, and Six Sigma Templates to make your job easier as a Six Sigma Project Manager -
Six Sigma Templates, Statistics Tables, and Six Sigma Calculators
Aug 16, 21 01:25 PM
Six Sigma Templates, Tables, and Calculators. MTBF, MTTR, A3, EOQ, 5S, 5 WHY, DPMO, FMEA, SIPOC, RTY, DMAIC Contract, OEE, Value Stream Map, Pugh Matrix

Site Membership
LEARN MORE
Six Sigma
Templates, Tables & Calculators
Six Sigma Slides
Green Belt Program (1,000+ Slides)
Basic Statistics
Cost of Quality
SPC
Control Charts
Process Mapping
Capability Studies
MSA
SIPOC
Cause & Effect Matrix
FMEA
Multivariate Analysis
Central Limit Theorem
Confidence Intervals
Hypothesis Testing
Normality
T Tests
1-Way ANOVA
Chi-Square
Correlation
Regression
Control Plan
Kaizen
MTBF and MTTR
Project Pitfalls
Error Proofing
Z Scores
OEE
Takt Time
Line Balancing
Yield Metrics
Sampling Methods
Data Classification
Practice Exam
... and more


