Lean Six Sigma
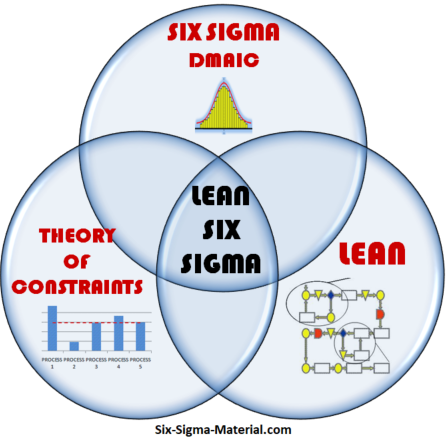
Lean Six Sigma is the combination of principles from Lean Manufacturing, Theory of Constraints, and Six Sigma into one program.
The three methodologies are summarized below.
- Lean Manufacturing reduces waste through process map improvements
- Theory of Constraints concentrates on relieving bottleneck operations
- Six Sigma reduces and controls process variation with the help of statistics
All three of them have a collective goal to improve the process performance towards a target (improve the mean) and reduce variability, improve customer satisfaction, and profitability.
You may fall short of satisfying the customer if using anything short of all three principles. Any of the three are beneficial but may not be enough alone to get the best results.
A successful project will have controllable inputs that provide consistent and accurate output. This type of result requires the collective use of all three methodologies.
The primary difference between Six Sigma and Lean Manufacturing is:
- Six Sigma uses statistics to identify and reduce variation in processes to satisfy the customer*. The first priority is control (which lead to precision) and to have that precise output on a target (which is accuracy).
- Lean Manufacturing focuses on finding and eliminating waste in processes to satisfy the customer*. This increase the velocity of process flow and thus allows a reduction in inventory (as long as it is a stable process...hence the purpose of Six Sigma) and possibly get cash sooner.
- Theory of Constraints is a method that is often combined in these two programs. This focuses on evaluating constraints operations and processes and using tools such as Takt Time and Line Balancing to optimize throughput.
*Remember the customer is not only the end-user but may also be your company and stakeholders within your company (such as the operators, nurses, drivers, etc.). These concepts are often combined within organizational structures and call "Lean Six Sigma".
Six Sigma is the most math intensive of the three methodologies and uses statistics to drive and validate ideas and processes. The others use more subjective input but all three require data and math to some extent.
Six Sigma has a higher emphasis on product quality than Lean Manufacturing, where-as Lean Manufacturing has a higher emphasis on speed and cycle time reduction than Six Sigma. Both cycle time and quality are important but each program focuses on them to a different extent.
It's hard to balance a line of processes if the output is highly variable and contains yield losses, waste, etc. All three programs play a role and there is some overlap in each of the methods which is the reason why Lean Six Sigma has become more popular.
Lean Six Sigma Practice Exam
Learn more about Lean Manufacturing
Tables, Templates, and Calculators
Subscribe to get access to entire site
Recent Articles
-
Process Capability Indices
Oct 18, 21 09:32 AM
Determing the process capability indices, Pp, Ppk, Cp, Cpk, Cpm -
Six Sigma Calculator, Statistics Tables, and Six Sigma Templates
Sep 14, 21 09:19 AM
Six Sigma Calculators, Statistics Tables, and Six Sigma Templates to make your job easier as a Six Sigma Project Manager -
Six Sigma Templates, Statistics Tables, and Six Sigma Calculators
Aug 16, 21 01:25 PM
Six Sigma Templates, Tables, and Calculators. MTBF, MTTR, A3, EOQ, 5S, 5 WHY, DPMO, FMEA, SIPOC, RTY, DMAIC Contract, OEE, Value Stream Map, Pugh Matrix

Site Membership
LEARN MORE
Six Sigma
Templates, Tables & Calculators
Six Sigma Slides
Green Belt Program (1,000+ Slides)
Basic Statistics
Cost of Quality
SPC
Control Charts
Process Mapping
Capability Studies
MSA
SIPOC
Cause & Effect Matrix
FMEA
Multivariate Analysis
Central Limit Theorem
Confidence Intervals
Hypothesis Testing
Normality
T Tests
1-Way ANOVA
Chi-Square
Correlation
Regression
Control Plan
Kaizen
MTBF and MTTR
Project Pitfalls
Error Proofing
Z Scores
OEE
Takt Time
Line Balancing
Yield Metrics
Sampling Methods
Data Classification
Practice Exam
... and more


