Check Sheet
A Check Sheet is one of the 7 basic quality tools for process improvement. The others are
Cause-and-effect diagram (aka Fishbone Diagram)
Stratification (or a flowchart or run chart).
A Check Sheet is a tally sheet that are part of project quality planning and control. The idea is to create a proper check sheet with the input from the Six Sigma team that allows you to collect the data needed to start making an analysis. The sheet will provide quantitative data for quality problems and support other tools such as:
- Histograms
- Bar Charts (shows the number or count of defects)
- Pareto Diagram (bar chart organized to to show 80/20 rule for defects)
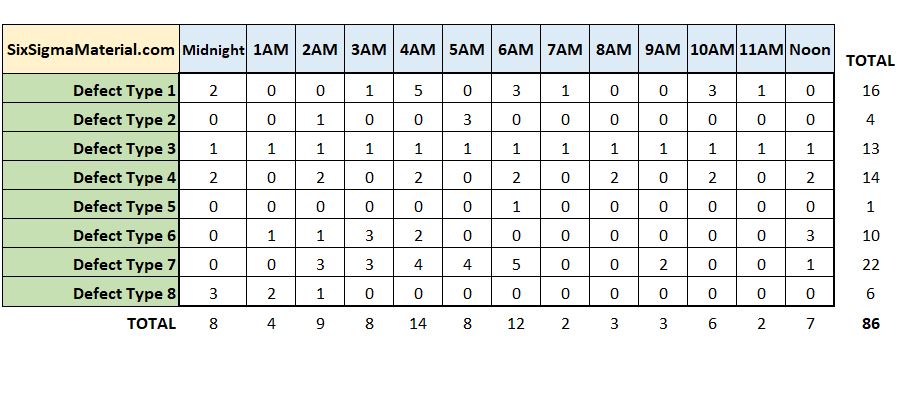
Check Sheet example
A few observations from the data within the Check Sheet:
1) 86 total defects recorded in a 12 hour span among the 8 defect types.
2) Defect Type 5 has only 1 instance.
3) Defect Type 7 has the most at 22.
4) Seems that there are a lot more defects from Midnight to 6AM, than 7AM -Noon
5) 4AM - 6AM in particular has a lot of findings of defects.
6) There are defects found in every hourly category.
This particular Check Sheet may or may not be enough data for you. And was it collected accurately...you may want to try an attribute MSA to confirm. If this data is accurate, easy to collect, and not costly, then you may want to collect more data across more time of the day, more days, more operators, machines, forms, etc.
Maybe some of the defects are related in a way that if you have one type it is very likely to lead to another type.
Or perhaps the RPN of Defect Type 7 is very low compared to the RPN of Defect Type 2 and therefore Type 2 needs more attention from the team.
All this data gets the team started on further analysis and both quantitative and qualitative discussions.
From here, you can create a Pareto Diagram and Histogram to help visualize the data rather than in a numerical table.
Comparing to a Matrix Diagram
Matrix Diagram analyzes relationships, patterns, results, causes, and interactions using a visual matrix. A goal is to also show the strength of the relationship.
Check Sheet is data collection tool that aims at quantifying data for further analysis which is why it is very important that the team agrees on the format and collection technique before starting to use the Check Sheet.
Comparing to a Checklist
Checklist is a list of things to do to execute a procedure or process. Similar to a Standard Operating Procedure (SOP) or Work Instruction (WI) to help ensure the steps are done accurately and completely. A Checklist would be a simplified and summarized form of a SOP or WI.

Site Membership
LEARN MORE
Six Sigma
Templates, Tables & Calculators
Six Sigma Slides
Green Belt Program (1,000+ Slides)
Basic Statistics
Cost of Quality
SPC
Control Charts
Process Mapping
Capability Studies
MSA
SIPOC
Cause & Effect Matrix
FMEA
Multivariate Analysis
Central Limit Theorem
Confidence Intervals
Hypothesis Testing
Normality
T Tests
1-Way ANOVA
Chi-Square
Correlation
Regression
Control Plan
Kaizen
MTBF and MTTR
Project Pitfalls
Error Proofing
Z Scores
OEE
Takt Time
Line Balancing
Yield Metrics
Sampling Methods
Data Classification
Practice Exam
... and more


