
Line Balancing
Description
Line Balancing is leveling the workload across all processes in a cell or value stream to remove bottlenecks and excess capacity. A constraint slows the process down and results if waiting for downstream operations and excess capacity results in waiting and no absorption of fixed costs.
Objective
Match the production rate after all wastes have been removed to the Takt time at each process of the value stream.
EXAMPLE:
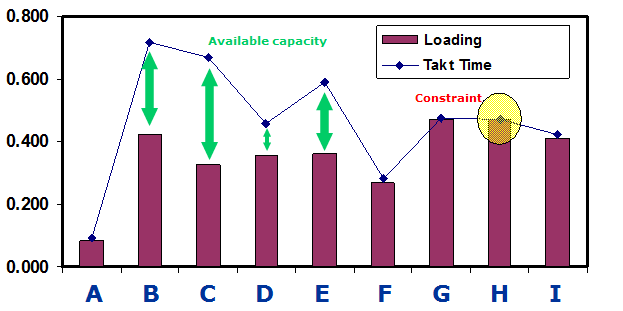
Taking the example from the Takt time page as the starting point, there were additional studies conducted each the remaining processes that it takes to make UNIT ABC.

Often the bottlenecks or areas of excess capacity are known by the team members but this analysis provides the quantitative data to prioritize activities to improve.

Process 1: Taking much longer than Takt time. Overtime is probably used to make up production and is the #1 constraint.
Process 2: Exceeding the Takt time, probably a lot of waiting and the excess capacity can be filled by absorbing some of the work from Process 1 and/or Process 4.
Process 3 & 5: Very close to meeting Takt time, not a focus area but possibly some best practices and application of LEAN tools can improve these loading rates. Improvement in these areas could be used to share workload from constraint processes.
Process 4: Taking longer than Takt time. Again, overtime is probably used or there are late deliveries, high expediting costs or unhappy customers. Apply Lean Manufacturing principles and try to alleviate workload to Process 2 or others that may be able be improved to absorb some of the workload.
Examine all the specific activities occurring in each process. Time studies, motion studies, and other Lean tools often provide most the ideas for improvement.
Develop a plan for immediate, low-cost improvements. Professional signage, advanced comprehensive training and capital investments are not needed or justified yet.
Run studies to determine the potential LOADING improvements. There is most likely not much that can be done to change the Takt time; focus on improving the LOADING (production rate).
Improving the LOADING, even in non-constraint operations is desirable, but the top priority is relieving constraint operations.
AFTER
The table and chart below shows the results of the Line Balancing improvements.
There were gains...and the success was to the point where there was excess capacity. All the activities could now be completed in four processes. Floor space was gained and excess older and fully depreciated equipment were sold for cash.
A new loading study was done and the results are shown.
Recall, the goal of Line Balancing is to have the loading rates meet the Takt time and this is accomplished as the chart indicates.

Takt Time and Line Balancing Calculator
 |
A Takt Time and Loading calculator with an example is available here. Within the file are explanations to assist with completing the template. |
Templates, Tables, and Calculators


Site Membership
Click for a Password
to access entire site
Six Sigma
Templates & Calculators

Six Sigma Modules
The following are available
Click Here
Green Belt Program (1,000+ Slides)
Basic Statistics
Cost of Quality
SPC
Process Mapping
Capability Studies
MSA
Cause & Effect Matrix
FMEA
Multivariate Analysis
Central Limit Theorem
Confidence Intervals
Hypothesis Testing
T Tests
1-Way ANOVA
Chi-Square
Correlation and Regression
Control Plan
Kaizen
MTBF and MTTR
Project Pitfalls
Error Proofing
Effective Meetings
OEE
Takt Time
Line Balancing
Practice Exam
... and more