|
 content.")

Measures of Central Tendency
Mean, Median, Mode
In a normally distributed set of data, all three measures of central tendency are approximately the same. Using the data sample below, calculate the measures of central tendency.
{1, 3, 8, 3, 7, 11, 8, 3, 9, 10}
Mean (arithmetic)
Since most populations exhibit normality (bell-shaped curve) or can be assumed to be normal, the mean is the most common measure for central tendency. It is used to describe normal data.
The formula is the summation of all the values divided by the sample size:
Sum of all values: 63
n: 10 samples
Mean = 6.3
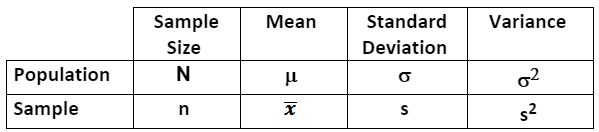
In this example, the mean is of a sample which is represented by x-bar. Sometimes M is also used to represent the sample mean. For a population mean, the Greek letter μ is used. See the table below for common notation.
Median
The median is the midpoint, the middle value or observation of the data set. If the set of data has an even count, the median is the average of the middle two values. This is measure for skewed or non-normal data.
Arrange the numbers in ascending or descending order:
{1, 3, 3, 3, 7, 8, 8, 9, 10, 11}
Since the sample is an even set of data (10 samples) and the middle two values are 7 and 8, then the average of the two middle values is 7.5.
Median = 7.5
Mode
The mode is the most commonly occurring value in the data set. Not commonly used as a measure of central location but can be found in the tallest bar of a vertical histogram chart.
Mode = 3, since it occurs more than any other value.
The table below summarizes notation for describing samples and populations.
Samples are properly described as statistics.
Populations are properly described as parameters.
Another example using Excel

Showing the formulas
For the Standard Deviation, Excel uses "n-1"
in the denominator to calculate the sample statistics (the rows in
Excel for the data were in rows 3-16).

Trimmed Mean
The trimmed mean is another measure of central tendency less frequently used but you may see it as an output on most statistical software programs.
This is a mean calculated by excluding a percentage of data points from the top and bottom tails of a data set. Usually 5% is trimmed off of each tail. But sometimes you can specify the percentage to trim.
The % value can not be <0 or >1.
In Excel, you can select the array of data and choose a % to trim off each tail using the TRIMEAN function.
TRIMMEAN(array, percent)
Array - the array or range of values to trim and average.
Percent - The fractional number of data points to exclude from the calculation. For example, if percent = 0.2, 4 points are trimmed from a data set of 20 points (20 x 0.2): 2 from the top and 2 from the bottom of the set.
NOTE:
This function rounds the number of excluded data points down to the nearest multiple of 2. If percent = 0.1, 10 percent of 30 data points equals 3 points. For symmetry, TRIMMEAN excludes a single value from the top and bottom of the data set.
Measures of dispersion are numerical statistics which describe the spread of data or the width of the distribution.
NOTE:
A normal distribution exhibits a mean, median, and mode that are approximately the same value.
Quiz Question
What is the MEDIAN of a normally distributed population with a mean of 5, standard deviation of 0.2, and a variance of 0.04?
A) 5
B) 1
C) 0.2
D) None of the above
Answer: A. With a normal distribution the mode = median = mean. The extra information about the standard deviation and variance are irrelevant.
Templates, Tables, and Calculators
Recent Articles
-
Process Capability Indices
Oct 18, 21 09:32 AM
 Determing the process capability indices, Pp, Ppk, Cp, Cpk, Cpm
 -
Six Sigma Calculator, Statistics Tables, and Six Sigma Templates
Sep 14, 21 09:19 AM
 Six Sigma Calculators, Statistics Tables, and Six Sigma Templates to make your job easier as a Six Sigma Project Manager
 -
Six Sigma Templates, Statistics Tables, and Six Sigma Calculators
Aug 16, 21 01:25 PM
Six Sigma Templates, Tables, and Calculators. MTBF, MTTR, A3, EOQ, 5S, 5 WHY, DPMO, FMEA, SIPOC, RTY, DMAIC Contract, OEE, Value Stream Map, Pugh Matrix -
Six Sigma, Six Sigma Training, Courses, Calculators, Certification
Aug 15, 21 10:27 PM
 One site with the most common Six Sigma material, videos, examples, calculators, courses, and certification.

Site Membership
LEARN MORE
Six Sigma
Templates, Tables & Calculators
Six Sigma Slides
Green Belt Program (1,000+ Slides)
Basic Statistics
Cost of Quality
SPC
Process Mapping
Capability Studies
MSA
SIPOC
Cause & Effect Matrix
FMEA
Multivariate Analysis
Central Limit Theorem
Confidence Intervals
Hypothesis Testing
T Tests
1-Way ANOVA
Chi-Square
Correlation
Regression
Control Plan
Kaizen
MTBF and MTTR
Project Pitfalls
Error Proofing
Z Scores
OEE
Takt Time
Line Balancing
Yield Metrics
Sampling Methods
Data Classification
Practice Exam
... and more
Statistics in Excel

Need a Gantt Chart?