|

 content.")
Project Management Team Tools
Executing a Six Sigma project involves more than technical knowledge. A Project Manager must be able to lead a team, remove obstacles, recognize emotional needs, deal with adversity, and understand other human elements.
The tools shown below are used depending on the situation within your project. Like many tools in your Six Sigma toolbox, not all of them will be used and do not force the use of a tool if not necessary.
The tools are briefly described below and are likely to be covered in some manner on a Six Sigma certification exam, especially for Black Belts.
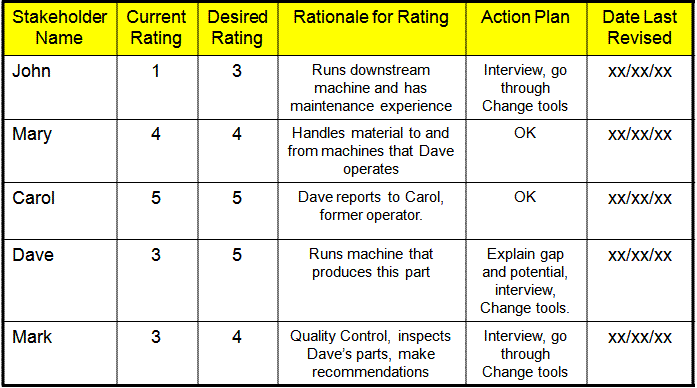
Stakeholder Analysis
The Stakeholder Analysis is a chart which gauges the positioning of stakeholders relative to change and commitment to the goals of the team.
Projects involve change and this often stirs emotions and encounters resistance. The higher the impact of the projected change the more important this tool becomes. The output of the Stakeholder Analysis is a representation of where the impacted people both inside and outside the system stand relative to change.
A sample template is shown below. Click here to learn more.
Multivoting
Multivoting technique is a decision-making tool to help the team to narrow down or choose from a long list of options.
After a brainstorming exercise, there may be hundreds of ideas. Tools like the Affinity Diagram or Fishbone may be used to organize the ideas to make them clearer to the team before using Multivoting.
Th team leader decides how many ideas will be allowed to survive at the end.
For example, if the list starts at 50, the leader may say that only 10 will be selected. Then after that, if it is still too many, another vote may take place to narrow it down further.
Each person voting will rank the ideas in order of their preferred priority. The highest priority in their opinion is given the highest ranking.
Using this example, each person gets to select 10 ideas and prioritize them, 10 is the score assigned to the highest priority idea and 1 for the lowest.
The votes are gathered anonymously and recorded by the team leader on a shareable board.
Usually, a lot of discussion takes place after the scores are summed for each idea. This discussion can shed light on information some people did or did not know before. This may lead to the need for another vote and further narrow the ideas.
Multivoting is different than straight voting since an idea may not be the top choice of anyone, but it may get a lot of high scores and rise to the top of the overall list.
This tool is similar to a Prioritization Matrix but done more anonymously with less objectivity. The Prioritization Matrix will likely take longer but provide more numerical evidence to support the decisions.
Force Field Analysis
At its core, this is a root cause analysis tool that can help you take action once the root cause has been identified.
This analysis helps predict the resistance that may be encountered by other company members for a proposed recommendation.
A current "situation", or the current method, is the result of forces for and against the current state being in equilibrium. In order to make a change, the forces need to change and create a new equilibrium.
This concept is credited to social psychologist Kurt Lewin. The tool helps identify and prioritize when and where to act to achieve a change.
The analysis includes creating a map of the forces helping and hindering the change,
and then prioritizing those forces so the change can be most effectively achieved.
Force field analysis is a map of the forces (pros & cons) driving or restraining the change. With open dialogue about the pros and cons (positive and negative forces), it becomes more apparent which forces should be prioritized to act upon to create the change.
The idea is to strengthen the driving forces to enable the change and reduce the forces holding back the change.
Nominal Group Technique
The word "nominal" is used in the name of this tool since the intent is to restrict communications to remove peer pressure in influencing the flow of ideas and creativity. The last thing a team wants is an "influencer" and steer the others in a direction than may dampen the true ideas from the other members of the team.
This tool is useful when a team is developing and prioritizing ideas that include controversial, or sensitive, issues.
As the GB/BB, you may be the facilitator of this 60-90 minute process. Be sure to remove your own bias.
- Before any open dialogue, the facilitator explains the problem to the team.
- The members independent and silently record their ideas.
- The facilitator goes around to each member and ask for one idea at a time and records them. No discussion is allowed at this point
- After all ideas are recorded, the facilitator leads the discussion and valuation of the ideas. The pros and cons of each idea are discussed. Some ideas may be combined.
- Voting is done and often done in a manner where others can't see each others votes.
Groupthink
A Six Sigma team leader may be an expert on statistics and using the related tools but before that is often an exercise of subjective root cause analysis. This involves open dialogue, often controversial, and uncomfortable discussions. The hard truth can be tough to uncover.
A fundamental breakthrough (which is often needed to achieve "Six Sigma" performance) often means upsetting the equilibrium and doing things drastically different. That's likely to ruffle some feathers in the organization.
Leaders should be aware of the Groupthink psychological phenomenon. Some participants on the team may be reluctant to share their beliefs and debate for their opinion if it seems to be going against the rest of the crowd or a vocal, or respected participant with a different opinion.
This influences the ability for the leader to get all the information that others, and the leaders, may benefit from knowing. As a Project Manager it's important to try and recognize if this is happening and possibly seek an anonymous method to getting this information out of everyone.
Project Management
Project Management is a field of study on its own. It's also a field in which you can earn a certification which some claim can command an extra 10-20% on an existing salary. Some terms often found in this arena are as follow:
PMI: Project Management Institute
PMBOK: the highly regarded guidelines, rules, and characteristics of projects across all industries which is produced by the PMI
PMP: Project Management Professional (PMP) is the certification you can achieve by passing an exam.
Critical Path: the longest sequence of activities within a project plan that must be completed on time for the entire project to be executed by its due date. Activities within the Critical Path must be done in sequence and the next activity cannot start until the previous activity is completed. In other words, two or more activities cannot be done simultaneously if they are in the Critical Path.
Feeding Tasks: supporting tasks feeding into tasks on the Critical Path. If these tasks are not completed in advance will delay the Critical Path
Feeding Buffers: a time-based safety factor that is put in place to protect the project's due date from other sources of variation that may take up extra time. The feeding buffer is added to places where chains of non-critical tasks feed into task on the Critical Path.
Learn about another useful tool in PM and Six Sigma called the Activity Network Diagram.
Project Management Questions
These are practice questions similar to those that may be found on a Six Sigma certification exam for a Green or Black Belt.
Cross-functional participation is typically used for which of the following?
A) Six Sigma project teams
B) Quality improvement teams
C) Self-directed teams
D) Projects that already have a solution and just need to be executed
Answer: A and B
To assemble an optimal cross functional team, which of the following places should be considered when identifying team members?
A) where sources or causes are likely to be found
B) those with process knowledge, info, skills
C) those that work within or where the problems resides
D) in areas or departments that will likely have remedies and solutions
Answer: A, B, C, and D
The upper levels of management typically supports a team best by:
A) Reinforcing positive results and not taking recourse on negative results
B) Providing support and direction
C) Developing company vision and mission statements
Answer: A, B, and C.
Recent Articles
-
Process Capability Indices
Oct 18, 21 09:32 AM
 Determing the process capability indices, Pp, Ppk, Cp, Cpk, Cpm
 -
Six Sigma Calculator, Statistics Tables, and Six Sigma Templates
Sep 14, 21 09:19 AM
 Six Sigma Calculators, Statistics Tables, and Six Sigma Templates to make your job easier as a Six Sigma Project Manager
 -
Six Sigma Templates, Statistics Tables, and Six Sigma Calculators
Aug 16, 21 01:25 PM
Six Sigma Templates, Tables, and Calculators. MTBF, MTTR, A3, EOQ, 5S, 5 WHY, DPMO, FMEA, SIPOC, RTY, DMAIC Contract, OEE, Value Stream Map, Pugh Matrix -
Six Sigma, Six Sigma Training, Courses, Calculators, Certification
Aug 15, 21 10:27 PM
 One site with the most common Six Sigma material, videos, examples, calculators, courses, and certification.

Site Membership
LEARN MORE
Six Sigma
Templates, Tables & Calculators
Six Sigma Slides
Green Belt Program (1,000+ Slides)
Basic Statistics
Cost of Quality
SPC
Control Charts
Process Mapping
Capability Studies
MSA
SIPOC
Cause & Effect Matrix
FMEA
Multivariate Analysis
Central Limit Theorem
Confidence Intervals
Hypothesis Testing
Normality
T Tests
1-Way ANOVA
Chi-Square
Correlation
Regression
Control Plan
Kaizen
MTBF and MTTR
Project Pitfalls
Error Proofing
Z Scores
OEE
Takt Time
Line Balancing
Yield Metrics
Sampling Methods
Data Classification
Practice Exam
... and more