|

 content.")
Nonparametric Test Flowcharts
In general, the power of parametric tests are greater than the power of the alternative nonparametric test when assumptions are met. As the sample size increases and becomes larger, the power of the nonparametric test approaches it parametric alternative.
In other words, when using a nonparametric test more data is needed to detect the same size difference as a parametric equivalent.
- The center for parametric tests is the mean
- The center for nonparametric tests is the median
Nonparametric tests also assume that the underlying distributions are symmetric but not necessarily normal. The assumption is these test statistics are "distribution-free. In other words, there aren't any assumptions made about the population parameters.
When the choice exist on whether to use the parametric or nonparametric test, if the distribution is fairly symmetric, the standard parametric test are better choices than the nonparametric alternatives.
For example, if you are not sure if two data sets are normally distributed it may be safer to substitute the Mann-Whitney test to reduce the risk of drawing a wrong conclusion when testing two means.
Nonparametric tests are used when:
- Parametric criteria are not met or if distribution is unknown
- These test are used when analyzing nominal or ordinal data
- Nonparametric test can also analyze interval or ratio data but parametric test should be used
- Quantitative, ranked, and qualitative data. Parametric is for only quantitative data
- Data has definite outliers (that can not be removed)
- Measurements are known to be imprecise
Advantages of nonparametric tests:
- Offer more power when assumptions for the parametric tests have been violated. And they can be almost as powerful when assumptions haven't been violated.
- Fewer assumptions about the data
- Work with smaller sample sizes
- They can be used for all data types or data containing outliers
Disadvantages of nonparametric tests:
- Less powerful than parametric tests if assumptions haven’t been violated.
- Critical value tables for many tests aren’t included in many computer software packages or textbooks
When to use Nonparametric Tests
- Data can not be assumed to meet any distribution (most commonly the normal distribution) assumptions. The population is assumed to be distribution-free".
- With qualitative data of nominal scale or ranked data of ordinal scale.
- When comparing Median values for skewed data (such as right or left skewed data). See Histograms for more insight on skewed data.
- When there are very few, if any, assumptions regarding the shape of the distribution. However, if there is a bi-modal distribution, the data should be reviewed and separated to correctly analyze the true process performance.
- Don't be forceful and rush into a nonparametric test when there is clearly two (or more) unique situations in within the data. Use the Runs Test to verify the nonnormality is related to random causes and not a results of special causes.
- When unsure whether to use parametric or nonparametric, you can easily run both tests. See what the difference is in the outcomes and it may not be a meaningful difference in your Six Sigma project. Therefore, don't sweat it. Make a decision and move on to the IMPROVEments Often times you'll find the results very similar and the hypothesis decision is the same for both.
Comparables to Parametric Tests
These are the most commonly used nonparametric equivalents. There are many more nonparametric tests but these are most likely to arise on a Six Sigma project and a certification exam.
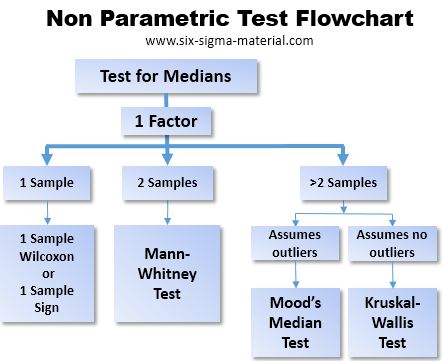
A sample and a target (or given value)
Parametric - One Sample t test (testing means)
Nonparametric - One Sample Wilcoxon or One Sample Sign* test (testing medians)
Two independent samples
Parametric - Two Sample t test (testing means)
Nonparametric - Mann-Whitney** (testing medians)
>2 independent samples
Parametric - ANOVA (testing means)
Nonparametric - Mood's median or Kruskal-Wallis test (testing medians)
Three or more matched (dependent) samples
Parametric - Two way ANOVA for matched samples
Nonparametric - Friedman Test
Other Nonparametric tests
Runs Test - to examine the randomness of the data and whether a sequence of samples are randomly distributed.
Spearman Rank Correlation Coefficient - to examine the correlation (association) between two data sets and assumes both variables are at least the "ordinal" type of data.
Goodman Kruska's Gamma - for testing the association for ranked variables.
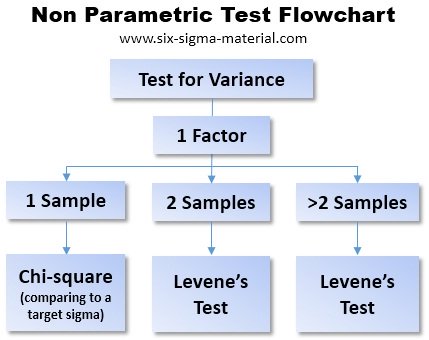
Levene's test - an alternate if F and t test assumptions are not met and is used to check the homogeneity of variances across samples.
Kendall Coefficient of Concordance - (aka Kendall's W) used to measure agreement among raters.
Sign test - uses the binomial distribution and specifies that each observation be assigned a plus or minus sign. The null hypothesis is tested that says the population median equals a certain value. A plus sign is assigned for values > than that value and a negative sign is assigned to values < than that value.
Mann-Whitney test is also known as the Wilcoxon test and the U test. It ranks all the observation in both samples combined. It is testing a null hypothesis that states the two samples came from the same population.
Refresher
You may be able to "transform" the data if the raw data does not meet normality assumptions.
The word "transformation" implies that each data point has the same calculation applied to it (including any specification limits when analyzing capability). Data that meets the assumption of normality allows a wider variety of test to be used.
Follow these steps when you believe the data does not meet normality assumptions:
- Attempt to transform the data such as through a Box-Cox transformation, which uses an optimal exponent, lambda, on all the positive (must be positive for Box-Cox) data points.
- Use the Runs Test to verify the data the is random (void of special causes).
- If the transformation doesn't work, then apply the nonparametric test.
There are other transformation methods such as the Yeo-Johnson which is similar to the Box-Cox but can be used with negative values and zero.
Other transformations are called Squared, Reciprocal, Exponential, Log (x), Lambert Gaussian, and Tukey's Ladder of Powers.
These are more advanced topics of which you should consult a Master Black Belt to ensure the most appropriate transformation is used depending on the distribution of the data.
Nonparametric Test in Minitab

Recent Articles
-
Process Capability Indices
Oct 18, 21 09:32 AM
 Determing the process capability indices, Pp, Ppk, Cp, Cpk, Cpm
 -
Six Sigma Calculator, Statistics Tables, and Six Sigma Templates
Sep 14, 21 09:19 AM
 Six Sigma Calculators, Statistics Tables, and Six Sigma Templates to make your job easier as a Six Sigma Project Manager
 -
Six Sigma Templates, Statistics Tables, and Six Sigma Calculators
Aug 16, 21 01:25 PM
Six Sigma Templates, Tables, and Calculators. MTBF, MTTR, A3, EOQ, 5S, 5 WHY, DPMO, FMEA, SIPOC, RTY, DMAIC Contract, OEE, Value Stream Map, Pugh Matrix -
Six Sigma, Six Sigma Training, Courses, Calculators, Certification
Aug 15, 21 10:27 PM
 One site with the most common Six Sigma material, videos, examples, calculators, courses, and certification.

Site Membership
LEARN MORE
Six Sigma
Templates, Tables & Calculators
Six Sigma Slides
Green Belt Program (1,000+ Slides)
Basic Statistics
Cost of Quality
SPC
Control Charts
Process Mapping
Capability Studies
MSA
SIPOC
Cause & Effect Matrix
FMEA
Multivariate Analysis
Central Limit Theorem
Confidence Intervals
Hypothesis Testing
Normality
T Tests
1-Way ANOVA
Chi-Square
Correlation
Regression
Control Plan
Kaizen
MTBF and MTTR
Project Pitfalls
Error Proofing
Z Scores
OEE
Takt Time
Line Balancing
Yield Metrics
Sampling Methods
Data Classification
Practice Exam
... and more