Venn Diagrams
Venn Diagrams, also called set diagrams or logic diagrams, are visual aids that show how different concepts or factors intersect with one another. Creation of the diagram is often credited to John Venn in the late 1800's.
There have been questions on this topic on Lean Six Sigma certification exams. You should know how to create them given certain information, how to write the formulas, and interpret a diagram into practical words and formulas.
These diagrams are usually created with:
- The box represents the entire population, or all the elements, the universal set (U). All of the elements = all the sets and those elements not in the sets.
- Circles within a box. A circle represents a set of something, which may include ideas, concepts, characteristics, numbers, features, or objects. Such as a set of clothes, sports, materials, tastes, sizes, buildings, shapes, colors, food, and the list is nearly infinite.
These diagrams can show how things are similar or different and where and how they overlap. Often, the center of a Venn diagram (the intersection of two or more circles) represents some main idea that can be decomposed into the various other circles, with labels on the outer portions more distinct than those toward the center. Overlapping areas can also be used to show where two otherwise disparate contexts share commonalities.
For example:
A box may represent all people that eat fruit in the universe. Circle A is a set of people that eat bananas, Circle B represents a set of people that eat apples, Circle C is a set of people that eat oranges.
Some people may have none of them three so they are those outside of all three circles but still inside the box.
Some people may eat more than one of these three fruits or possibly all three of them. Those that eat >1 of the three fruits would be shown in overlapping circles.
Other notes:
Often times the circles in the diagram are not to scale, but a Venn diagram in which the area of each shape is proportional to the number of elements it contains is called an area-proportional (or scaled) Venn diagram.
Usually Venn Diagrams comprise of 2-3 circles but there are higher order forms that can use many circles, spheres, ellipses, and other shapes.
The figure below represents mutually exclusive events of A and B.
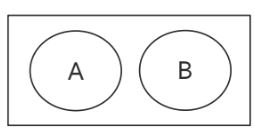
which is the P(A or B) = P(A) + P(B)
The figure below represents an intersection of A and B.
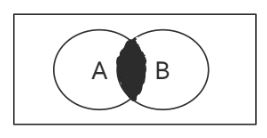
which can be expressed as
A ∩ B
A and B
The intersection of A and B.
The elements in both sets A and B
The figure below represents a union of A and B.
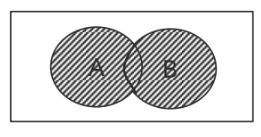
which can be expressed as
A U B
A or B
The union of A or B
Any element in set A or set B
The figure below represents the complement of A (A')
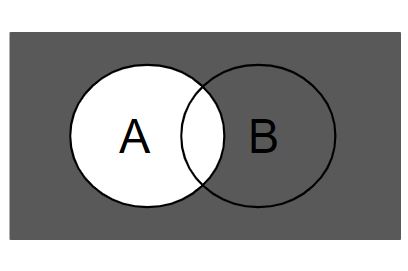
which can be expressed as
not A'
complement of A
any elements in U that are not in A
Figures of speech
Venn diagrams are often used in statistics to establish probabilities. We do this by reading information from the Venn diagram and applying the following formula.
In statistics, it is said as:
Probability = total # of outcomes / # of desired outcomes
For Venn diagrams we can say
P(A)= total # of elements / # of elements in set A
P(A)=number of elements in set A / total number of elements
Notation
ξ represents the whole set, aka the universal set (the box)
∅ represents the empty set, a set containing no elements
P(A) represents the probability of 'A'
n(A) represents the number of elements in Set A, or cardinality of Set A
n(B) represents the number of elements in Set B, or cardinality of Set B
n(A ∩ B) = number of elements in Set A and also in Set B, intersection of Set A and Set B
n(A U B) = number of elements in Set A or Set B, union of Set A and Set B
Example One
ξ = {1,2,3,4,5,6,7,8,9,10,11,12,13,14,15,16,17,18,19,20}
Set A = {odd numbers} which are 1,3,5,7,9,11,13,15,17,19 (10 of them total)
Set B = {multiples of 5} which are 5,10,15,20 (4 of them total)
Some numbers are in A and B which are 5 and15
The numbers (elements) that are not in A or B but are within the box are 2,4,6,8,12,14,16,18
Find P (A ∩ B)
Two numbers are in the intersection of A and B (in both A and B)
The probability of A ∩ B = 2/20 = 0.10 = 10%
Find P (A U B)
Among both A and B there are 12 numbers out of 16 = 12/16 = 3/4 = = 0.75 = 75%
(1,3,5,7,9,10,11,13,15,17,19,20)
Example Two
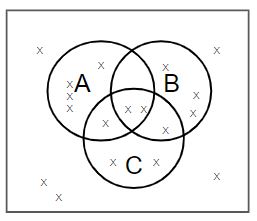
From our example earlier, let's put some figures into place and use the Venn Diagram below:
The box represents all people that eat fruit in the universe (could be any kind of fruit). The are 18 total people represented in the universe in this case. Each x represents one person.
ξ represents the whole set (1-18)
- Circle A is a set of people that eat only bananas
- Circle B represents a set of people that eat only apples
- Circle C is a set of people that eat only oranges
Some people may have none of them three; those are outside of all three circles but still inside the box.
Some people may eat more than one of these three fruits or possibly all three of them. Those that eat >1 of the three fruits would be shown in overlapping circles.
QUESTIONS
How many people do not eat only apples, oranges, or bananas? 5. So, 5 people eat fruit but not apples, oranges, or bananas.
One person is chosen randomly. What is the probability of someone not eating an apple, orange, or banana? 5/18 = 27.8%
How many eat apples, oranges, and bananas? In other words, what is the intersection of A, B, and C (which can be expressed as A ∩ B ∩ C): 2
P (A ∩ B ∩ C) = 2/18 = 11.1%
One person is chosen randomly. What is P(A or B) = P(A) + P(B)? 11/18 = 61%
What is the complement of C'? 12/18 = 66.7%. This is all elements outside of Set C.
One person is chosen randomly. What is the probability that person eats bananas or apples but not oranges. 0/18 = 0%
One person is chosen randomly. What is the probability that person eats apples but not any other fruit. 4/18 = 22.2%
How many people like more than one fruit? 4
What is the union of A and B and C? Which can be expressed as A U B U C (or any element in Set A + Set B + Set C)? 13
One person is chosen randomly. What is P(A or B or C) = P(A) + P(B) + P(C)? = 13/18 = 72.2%. This means that 72.2% of the people eat either an orange, banana, or apple (or possibly both or all three).
Another example
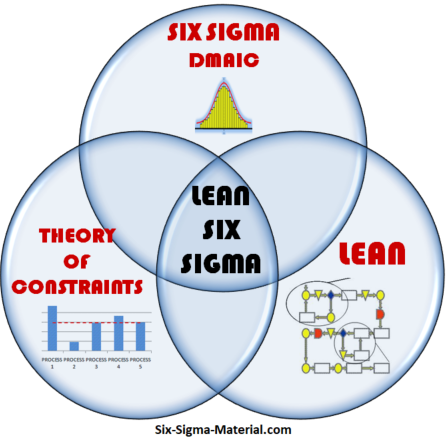
Below is an example to show that Lean Six Sigma is an intersection of three topics:
1) Six Sigma
2) Theory of Constraints
3) Lean Manufacturing
They are all different from one another in many ways but also have some commonalities. And the combination of all three concepts creates Lean Six Sigma.
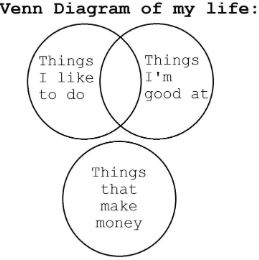
Venn Diagram Humor

Site Membership
LEARN MORE
Six Sigma
Templates, Tables & Calculators
Six Sigma Slides
Green Belt Program (1,000+ Slides)
Basic Statistics
Cost of Quality
SPC
Control Charts
Process Mapping
Capability Studies
MSA
SIPOC
Cause & Effect Matrix
FMEA
Multivariate Analysis
Central Limit Theorem
Confidence Intervals
Hypothesis Testing
Normality
T Tests
1-Way ANOVA
Chi-Square
Correlation
Regression
Control Plan
Kaizen
MTBF and MTTR
Project Pitfalls
Error Proofing
Z Scores
OEE
Takt Time
Line Balancing
Yield Metrics
Sampling Methods
Data Classification
Practice Exam
... and more


