Takt Time
Takt Time is the rate at which products or services should be produced to meet the rate of customer demand. It is derived from the German word, Taktzeit, which is often referred to as the heartbeat or drumbeat of production in Lean Manufacturing.
The value, in conjunction with the current loading (production) rates, is used to analyze process loads, bottlenecks, and excess capacity. This evaluation will indicate which operations are ahead of the demand rate and which are not, both indicating opportunities for improvement. This is strictly a formula and calculation. Use it to compare the measured "loading" to quantify whether an operation meets or exceeds the takt time and by how much.
The unit of time in the numerator & denominator must be the same.
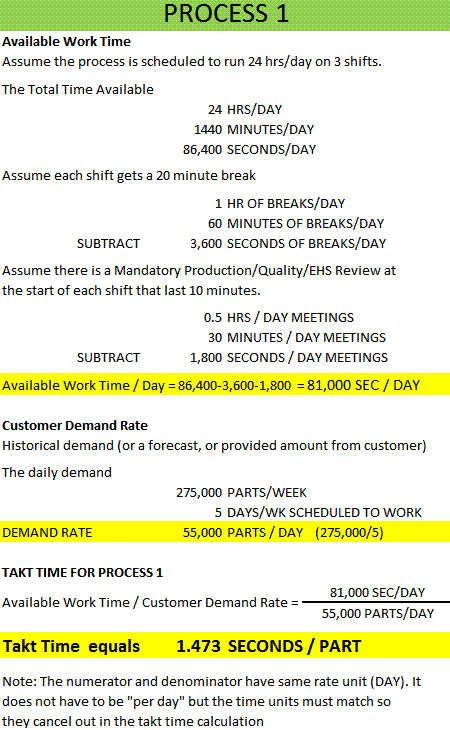
The numerator, Available Work Time, is often expressed as Minutes/Shift, Seconds/Day, Minutes/Day and so on.
The denominator, Customer Demand Rate, is often expressed as Parts/Min, Units/Shift, Pieces/Day, and so on.
EXAMPLE:
The first process is labeled PROCESS 1 because if the amount of work time available OR the demand on that particular machine or group of machines varies from one process to another then each process will have its own takt time.
Takt Time and Loading Calculator
|
A Takt Time calculator (along with other templates and calculators) with an example is available here. The formulas within the spreadsheet are visible to help comprehend the impact of the inputs. |
Takt time values are rarely the same across the entire value stream if the layout is departmentalized. Chances are these machines (processes or services) share demand. However, in many workcells all the machines have the same customer demand rate and the same available work time making the line balancing activity an easier task.
Example:
If Customer A orders 55,000 units/day that require Process 1 (from above) and these units also require downstream Process 2
AND
Customer B now places an order and wants 55,000 units/day that require Process 1 but NOT Process 2.....then the takt time for each process is different.
Given the work available is the same for each process at 22 hours/day = 1,320 minutes per day = 79,200 sec/day.
CALCULATION:
Process 1:
Takt Time= 79,200 sec/day / 110,000 units/day = 0.72 Seconds / Unit
Process 2: Takt Time = 79,200 sec/day / 55,000 units/day = 1.44 Seconds / Unit
CONCLUSION:
The load rate (production rate) must be twice as fast on Process 1 than Process 2 to keep up with customer demand.
Those operations that are performing better than takt time also have opportunity for improvement; often the load from a process that is behind can be offloaded and shared. The amount is determined by the differences in the current load and takt time studies for each process.
The team's job is to level the workload, line balancing, across the processes by studying these values.
The study is normally depicted using bar graphs and will not only show bottlenecks or excess capacity but will also quantify the amount and relativity between all operations.
Interpret the Chart
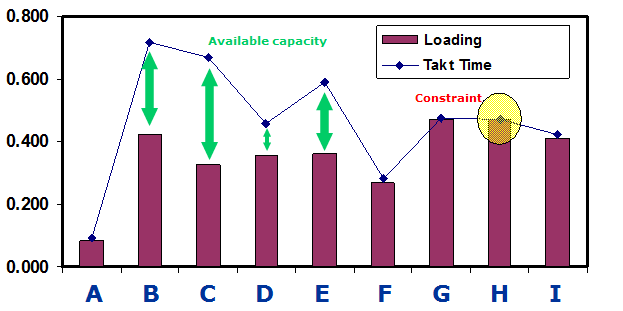
The chart below shows the results of an evaluation of the nine process (A-H) to produce a particular product.
What takeaways are there?
- Processes B,C,D,E have excess capacity since they are outperforming the customer demand or takt time. In such a situation, evaluate the manpower for the possibility of shifting it to a constraint operation or reduce overtime.
- Processes A, F, G, H, and I are nearly perfectly matched and performing at the takt time. In reality this is very difficult to achieve and maintain loading at the exact level of the takt time. For one, the takt time often changes (due to customer demand changes).
- Process H may be a minor constraint. Perhaps a SMED event could deliver enough improvement to alleviate any bottleneck.
In this type of situation, there should not be any late deliveries to the customer. Of course, this is a snapshot in time.
If the loading or the takt time have a lot of volatility (or variation), then that is not going to show up necessarily in this chart. As with any tool that represents a snapshot in time, variation could result in many problems.
Bottlenecks
Bottleneck operations are those operations where the Load Cycle > Takt Time.
Team members probably already know which operations have capacity and which are the constraints but what they don't know is the extent or the degree and amount compared to the other processes.
In order to meet the delivery demands of the customer each bottleneck will need to be resolved so the loading is faster than the takt time.
But where do you focus your efforts first?
The study will only provide numbers. A small constraint in one area due to high scrap and rework may be much costlier overall than a larger time constraint in another area.
These numbers along with reasoning on costs, scrap, and other subjective measures are for the team to determine prioritization for the improvements.
This is why a Finance professional and key stakeholders must contribute to the team. As a Six Sigma project manager you can only present the numbers but also offer up what is NOT in the numbers that could shift priorities.
The goal is to get the entire line balanced while removing waste. Waste reduction (rework, scrap, over production, and other 7-Wastes) should be targeted aggressively and then a loading study should be done prior to significant investments into line balancing.
Videos & More Examples
Subscribe to access the entire site
Templates, Tables, and Calculators
Recent Articles
-
Process Capability Indices
Oct 18, 21 09:32 AM
Determing the process capability indices, Pp, Ppk, Cp, Cpk, Cpm -
Six Sigma Calculator, Statistics Tables, and Six Sigma Templates
Sep 14, 21 09:19 AM
Six Sigma Calculators, Statistics Tables, and Six Sigma Templates to make your job easier as a Six Sigma Project Manager -
Six Sigma Templates, Statistics Tables, and Six Sigma Calculators
Aug 16, 21 01:25 PM
Six Sigma Templates, Tables, and Calculators. MTBF, MTTR, A3, EOQ, 5S, 5 WHY, DPMO, FMEA, SIPOC, RTY, DMAIC Contract, OEE, Value Stream Map, Pugh Matrix
Site Membership
Click for a Password
to access entire site
Six Sigma
Templates & Calculators
Six Sigma Modules
The following are available
Click Here
Green Belt Program (1,000+ Slides)
Basic Statistics
Cost of Quality
SPC
Process Mapping
Capability Studies
MSA
Cause & Effect Matrix
FMEA
Multivariate Analysis
Central Limit Theorem
Confidence Intervals
Hypothesis Testing
T Tests
1-Way ANOVA
Chi-Square
Correlation and Regression
Control Plan
Kaizen
MTBF and MTTR
Project Pitfalls
Error Proofing
Effective Meetings
OEE
Takt Time
Line Balancing
Practice Exam
... and more


