NP-Chart
Attribute (Discrete) Control Charts
NP-Chart is an attribute control chart used when plotting:
- DEFECTIVES
- BINOMIAL ASSUMPTIONS SATISFIED
- CONSTANT (fixed) SAMPLE SIZE (subgroup size)
Each observation is independent.
Use this chart to develop upper and lower control limits (UCL and LCL) and determine performance of process over time. This chart plots the number of non-conforming units or pieces. Each piece or unit may have one or more defects that make it defective.

The fixed subgroup size allows for constant control limit values, the is not a need to recalculate the control limits for each sample size. If the defective level is very low, (sample size * average % defective < 5), then apply binomial distribution exact limits.
The NP Chart is used to detect shifts >1.5 standard deviations. In order to detect smaller shifts there are other charts that can be applied to variable and attribute data such as Exponentially Weighted Moving Average (EWMA) and Cumulative Sum of Quality Characteristic Measurement (CUSUM).
Below is sample set of data and the NP-Chart follows.


The chart indicates that the process is in control. The control tests that were used all passed in this case. Recall, there are a variety of control tests and most statistical software programs allow you to select and modify these criteria.
The Voice of the Process" has a centerline which indicates that on average there will be 9.96 defective units (not the number of defects) on a given run and expect between 1.69 (2) and 18.23 (18) defective units per run.
Reminders for using NP-Charts:
- It is not possible to have more defective units than units produced.
- P-bar is the average percent of defective units per group/lot/sample size
- Constant lot (group) size.
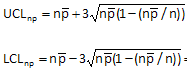
Calculating the 3 sigma Control Limits
Six Sigma Certification Problem
With 50 samples (n=50), a process has a p-bar of 0.25. What are the upper and lower three sigma limits (UCL/LCL)?
A) 0.25 and -0.25
B) 12.5 and -12.5
C) 21.69 and 3.31
D) 15.56 and 9.44
Answer: C
Find n*p-bar (the centerline) first which is 50 * 0.25 = 12.5
There are over additional 180 sample DMAIC certification problems that can be accessed here


Site Membership
Click for a Password
to access entire site
Six Sigma
Templates & Calculators

Six Sigma Modules
The following are available
Click Here
Green Belt Program (1,000+ Slides)
Basic Statistics
Cost of Quality
SPC
Process Mapping
Capability Studies
MSA
Cause & Effect Matrix
FMEA
Multivariate Analysis
Central Limit Theorem
Confidence Intervals
Hypothesis Testing
T Tests
1-Way ANOVA
Chi-Square
Correlation and Regression
Control Plan
Kaizen
MTBF and MTTR
Project Pitfalls
Error Proofing
Effective Meetings
OEE
Takt Time
Line Balancing
Practice Exam
... and more