|
 content.")


Value Stream Mapping (VSM)
The process of value stream mapping visually links the flow of materials and information from customer to beginning of the process, which includes processes within the walls or your company and beyond.

Most current state value stream maps find that <5% of the total lead time for a process is value-added ("value-added" means the time is spent adding value to the product or service which the customer is willing to pay for it or it is compliance/regulatory time).
Actually, many processes have < 1% of value-added time. After all the hard work of creating the map and agreeing to numbers, the value-added percentage is usually shocking....and it means OPPORTUNITY. This will get the team members motivated.
Value Stream Mapping is more detailed than a Process Map since it is supported with numerical analysis. However; it also involves a Gemba walk to observe the actual process and document actual cycle times, actual inventory levels, quality, etc. This also could mean traveling to observe processes that occur outside of your location.
The objective of value stream mapping is to:
- create highly visual map and learn true flow of material and information
- identify value-added and non-value added waste with quantification
- identify constraints (also use Takt Time and Line Balancing tools)
- create Kaizen projects or Six Sigma projects to achieve future state
- reduce lead time and "bad" inventory (free up cash!)
It can be done on a computer or on paper with a pencil. When value stream mapping, it is necessary for two maps created (possibly more).
Two Maps are necessary (minimum)
Two maps, at a minimum, are needed to represent the:
- CURRENT STATE
- IDEAL STATE
- and possibly a FUTURE STATE (LONGER TERM)
There may be a short term and longer-term future state map depending on the how detailed the team wants to proceed.
Current State
Capture the current process despite how ugly it may be. There are often situations where cycle times vary, batch sizes vary for appropriate reasons, and it is difficult to come up with values for the map. It is important to prepare for this as a GB/BB when leading the team so a consensus can be reached on all the "what-if" scenarios. Be consistent with how the values are obtained and used on the map.
It is ideal to get a long run historical sampling of data for Changeover Times, Machine rates, Quality, etc. so these numbers can be used as baselines to compare against actual observations.
Ideal State
Develop a short term (with the week or a few weeks) map that is achievable with existing resources. The objective is to begin to change the paradigm or the culture and make the positive change visible. This helps with the next iteration of improvements. Select a specific product family, set of machines, group of people if it isn't possible to implement improvements across everything.
The key here is to make a meaningful change, get a quick win and something accomplished that people believe (and can verify financially) made a positive difference.
Future State (longer term)
Develop the desired future state and long-term vision. The team should get creative and develop the future state regardless of what they think can be accomplished with some discretion as to what is practical and economical.
The future state should be aligned with company goals, mission, and vision. Of course, the company goals should have Customer Satisfaction as priority.
|
|
|
Inputs
The following information is needed to construct a value stream map (at a minimum). Some maps are more comprehensive but not always necessary.
- Cycle Time
- Manpower ratio, number of workers
- Inventory level between each process
- Batch sizes
- Defect performance (or the Quality in OEE)
- Lead times from raw material, each process, delivery to customer
- Inspection may be a separate process - be prepared to study it as a process
"Nice to have information" to steer discussions with additional data:
- The three components of OEE (Availability, Performance, Quality)
- Maximum speed a machine, form, or part can be produced
- Distances to outside processors (drive time and processing time) if applicable
- Changeover time (C/O)
- Yield metrics (FY, TPY, RTY, NY, DPMO, DPU, DPO)
- Understanding of "what-if" scenarios and variations of route that exist
- Raw material quality performance
- Takt time and Loading
- Compliance, Regulatory, or Business mandated policies
- Serious Health and Safety considerations
Who is needed for Value Stream Mapping?
The Facilitator for creating the maps is the GB/BB leading the project. The team probably does not expect you to help make decisions...and probably prefer you refrain from making decisions and let the experts (team members) provide inputs and decisions for actions. The Facilitator lays the ground rules, explains the tool, and the expected outputs.
The Process Owner must be there to settle tiebreakers and ensure subject matter experts and key stakeholders are engaged and participating.
Try to get a cross-functional representation of 5-8 members involved in the process; however, too many can significantly slow the mapping process...it is already a time-consuming process depending on the number of steps in the process.
Depending on the process, the key stakeholders could be:
- Machine operator, possibly a material handler or driver
- Supply Chain
- Customer service or Sales
- Quality
- Process Owner
- IT or person familiar with informational flow
- Maintenance
- Supervisor or Department Manager
Finance is always a key stakeholder. However, this exercise at this point usually does not include them...unless the process involves mapping a Finance process (such as closing, payable or receipts process, or preparing a budget).
Creating a Value Stream Map
The mapping exercise starts with the customer. Add information such as location(s), takt time, information flow, part numbers involved, etc.
- At the top-right of the sheet is the customer(s) information and icon.
- Create the information flow to your company that starts the process. This could be Production Control, an EDI collection center, customer service, Sales, etc. This icon is located in the center of the sheet
- Create the information flow to the Supplier(s). Those icons are placed on the left side of the sheet.
- Working from left to right, add the process names, manpower, and complete the data boxes.
- Between each process, supplier, and customer add the method which the inventory is stored or moved along with quantity.
- Also add the method that schedules each process and how the information is communicated.
- At the bottom will be a step-function line. The top steps are for the Value-Added time to make a part (or Economical Order Quantity).
- The bottom lines are for the waiting and Non-Value Added time. Some of this time may be waiting, lead time, material handling, conveyance, trucking and/or some other form of transportation.
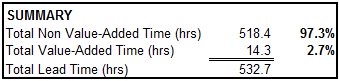
- In the bottom is a summary of the data in a table. In this table is a sum of the Value-Added Time, Non-Value Added Time, Total Time, and the Value-Added Time expressed as a % of the Total Time.
At the bottom of the map, it is a good idea to add a color code legend if several colors were used for a purpose. Explain any notes, asterisks, and formulas that are within the map.
Three Sections

TOP (1): INFORMATION FLOW
This area of the VSM map is for the flow of information, materials to and from the customer(s) and Production (or Process) Control. The mapping exercise actually begins with the Customer(s) data.
The customer name(s), location, takt times, part numbers, and as much relevant information should be placed in the upper right corner of the map.
Production Control (or Process Control) is placed in the center at the top of the map.
The Supplier(s) are usually shown in the upper left area of the map which includes name(s), description of parts supplied, frequency of delivery and amount delivered.
MIDDLE (2): MATERIAL FLOW
The Data Boxes, manpower ratios, inventory level and type of movement.
BOTTOM (3): LEAD TIME LADDER
Value-Added + Non-Value Added Time = Total Process Time.
Reminder, the % of Value Added Time is usually <5% and don't be alarmed if it is less that 1% in the current state and the future state is still <5%. The goal is to improve. Set realistic and achievable goals. Educate the team about waste, teach them to "see-it" and target the low hanging fruit of the 7-Wastes.
Most teams are often surprised when presented with this data and it begins to visually illustrate the opportunity.
In the hypothetical example below, the Summary Table shows that the Total Value-Added Time is on 2.7% of the Total Lead Time. It is common to find that there is an alarming amount of time spent in staging (waiting) or transportation.
The Non-Value Added Time is shown on the upper line
The Value-Added time is shown on the lower line.
Ensure the units of time are consistent when calculating the total and percentages for the Summary Table.
Value Stream Mapping Example

Recall, this above example couple be an example of value stream mapping of the CURRENT STATE. The team now shall come up with improvements to reduce the lead time and increase the percent of Value-Added time.
The purpose of this entire exercise to reduce the amount of time to earn cash and get paid for all the costs that went into creating and selling the product. A more responsive value stream also reduces risk and provides more flexibility to react in adverse situations.
The future state map may show Kaizen Events, Green Belt project ideas, and Black Belt project ideas. There is also a good chance that through all the discussion that some ideas will just be done immediately.
Data Box
One of the most informative icons on the Value Stream map is the Data Box. Within are lot of numbers that tell a valuable story in itself and just as importantly among other processes of the value stream. The figures in the Data Box should be tailored to meet the needs of your project.
Lets apply a hypothetical example to create a Data Box. Part Number 1298 was being mapped and you are gathering data for a Robotic Welding Process.
The Changeover time from the last good piece from the previous job (PN 4567) to the first good piece this job (PN 1298) was 7 minutes. You also know that the Changeover Time at this process across all parts averages 5 minutes (the data was found to be normally distributed).
The average changeover to this PN 1298 from all other part numbers over the course of year averaged 4 minutes (also found to be from a normal set of data).
After running for 12.25 hours the job was complete. Each Part 1298 has three welds. If any one weld has a defect the entire part is defective and can not be reworked.
Inspection takes place after the process is completed on all the parts.
The job was scheduled to make a batch of 1,350 acceptable pieces.
There is one attendant to monitor 4 robotic welders (0.25/machine).
After 12.25 hours (735 minutes) of planned time here are the following statistics:
- 1360 pieces were produced in total since the normal scrap rate of defective pieces is 0.74% for PN 1298.
- 48 welds found with defects.
- 28 defective parts (some parts had more than one defect).
- None of the pieces could be reworked and all 28 pieces were scrapped.
- Two instances of downtime for unplanned repairs that were >15 minutes and totaled to 39 minutes.
- The ideal production rate of robotic welding for this job is 2.0 pieces/minute. However, further research into the machine manual indicates that the machine was designed to run a maximum rate of 2.2 pieces/minute.
- The Takt Time for PN 1298 from the customer is 100 pieces/day.
- The historical Loading performance of all parts across this robotic welding process is 93 pieces/day.
- The robotic welder is currently running around the clock for 6 days/week, Monday-Saturday.
Shown below are some of the figures found in the Data Box.

TAKEAWAYS:
NOTE: This is a fairly detailed Data Box. Completing this level of detail may not be necessary and could be unreasonable if there are numerous processes in a value stream. Use your discretion as a GB/BB to portray the most relevant, practical data.
Due to the excessive loss of pieces, only 1,332 pieces were found to be acceptable. This means the next batch will have to be larger to compensate for the loss. Depending on the amount of safety stock and buffer stock this could require an unplanned break-in to make the pieces or wait until the next planned scheduled interval and produce the extra pieces at that time.
The robotic welding process across all parts is not meeting Takt time. This means the machine will have to run the 7th day (Sunday). This could require more labor to make sure the machine is fed and unloaded properly or to attend to any maintenance issues. Or, a Kaizen Event could be scheduled to reduce downtime and reduce Changeover time.
Another option is to understand why the machine's ideal speed is 2.0 pieces/min when it was designed to run 2.2 pieces/min. There is another 10% of capability that could be permanently improved.
Due to the lack of built-in quality, every part has to be inspected. While that timing is not part of this example, that is clearly an opportunity and could be a bottleneck as well (perhaps more severe than this robotic welding process).
This part has a longer C/O time than the average of all the parts. It is dragging the average higher as well. Investigate the entire set of parts that go across this process and find the optimal sequence to run them that minimizes that C/O time across entire spectrum of parts. Create a "Scheduling Sequence" or "Wheel" that optimizes this operation.
CAUTION
because the IDEAL sequence for one operation may NOT be the ideal sequence to run the the parts in the next operation if you plan to FIFO into the next operation. Optimizing one operation could sub-optimize (or make it worse) the changeover times at the next operation. The goal is to optimize the most valuable operation to get the most out of the entire Value Stream.
Find the right sequence and the Economic Order Quantity that optimizes the ENTIRE value stream.
Whenever possible capture an actual event to get a snapshot of a cycle time, changeover time, and all the other metrics. However the GB/BB Project Manager should also have historical data to run measures of central tendency and dispersion over a long term sample.
Often times a part number will be split among two or more machines at a process step. This further complicates the value stream map but can also be ripe for opportunity due to the complexity and number of variables to improve. This should be modeled within the map.
The Availability is dragging down the OEE. There were two events of unplanned downtime >15 each for a total of 39 minutes. Those two events could be examined using root cause (5-Why) and improvements put in place and possibly read-across to other machines or parts.
There is one attendant for every 4 welders. This ratio should be reviewed by conducting a job study to find out if the ratio should be increased or decreased to maximize the time without over-working or underutilizing the person. And although a study may show proper utilization, it still may be possible to train the person to be more efficient.
As you can see, there are numerous ways to improve a process and it starts with good data and GEMBA to understand the facts. There are only so many resources, so the team needs to make decisions to improve only the KPIV's and focus fixing and controlling 20% of the input variables that get 80% of the ideal result (Pareto Principle).
Kaizen Event
The purpose of the map is to expose opportunities and help prioritize. One major goal is often to reduce the cash conversion cycle from payment outlay to payment receipt. The shorter this time frame, the more working capital is available for investment, reduce debt, and allows your process to be quicker to react to change.
This could also be a differentiator from your competitors if it enables quicker response to new business. We all know that forecast get more and more unreliable the further out they go in time, so a quicker process reduces the dependence on longer range forecast which reduces the risk of overbuilding or the opposite.
Target the steps and processes with the most lead time. One thing the map usually doesn't show is rework loops or variation in lead time between processes. Again, the mean or average is just part of the puzzle.
The goal of Six Sigma is also to reduce variation and this is done by eliminating outliers (a.k.a. special cause), controlling the sources of variation and being more stable. This will have a very positive outcome and may not affect the map at all. Although, usually controlling and tightening variation creates a shift in the mean in a favorable direction too.
Each tool has its pros but also its limitations and very rarely does one tool depict all the relevant information. It is the responsibility of the GB/BB to mine the data for critical information that can lead to most effective improvements.
Some of the opportunities found from value stream mapping can be addressed through a Kaizen Event or Blitz. These are projects that are more than simply doing but yet don't require a Six Sigma project. The solutions are known and agreed upon, but a team and collective effort would be best to solve the problem.
See our module to help prepare for a Kaizen Event.
Buffer Stock vs. Safety Stock
At the beginning of a value stream and between most operations there is inventory. Some inventory is waste, some is "planned" and there is a difference in the "planned" inventory.
Two such "planned" types of inventory are Buffer Stock and Safety Stock.
Buffer Stock and Safety Stock are not the same. Both levels of stock are calculations to ensure that a Pull System functions without risk of carrying too much inventory (bad inventory) but just the right amount to prevent running out and being unable to support the customer.
Not all inventory is bad. While it is ideal to have zero, that is often impractical so the next best option is to have inventory based on objective criteria with a goal to continuously reduce it based on fixing the inputs that drive the calculation lower. This is called addressing the leading indicators which in turn will adjust the perpetual mins/maxs and lower or raise inventory based on real performance.
This takes the emotion and subjectivity out of the discussion and decision making process which is an impossible task when there are hundreds or thousands of parts to track.
- BUFFER stock is stock used to protect against variation from the company. This includes variation induced by the company's suppliers, outside processors, and all of its own processes.
- SAFETY stock is inventory purposely placed into the value stream to protect against customer variation. The customer may have variation in shipments or releases due to a number of reasons from seasons, recalls, growth, end-of-life, etc.
See the module on Kanban (Pull) systems to learn more about "insurance stock".
Value-Added vs. Non-Value Added
Theoretically, the perfect state of a value stream or flowchart is to have 100% of the steps adding value. Analyzing each step and looking for the non-value added steps is done in the Process Mapping (Flowchart) stage but this concept should be in the team's mind during all phases of the project.
What does this mean?
Value-Added:
- Physical change in the product
- Customer is willing to pay for the step or service
- First time yield is 100% - done right the first time
There is some debate about compliance steps. Certain steps are done to meet compliance criteria such testing and documentation. There is usually opportunity to streamline this "regulatory" or "business-mandated" processes.
The team should review these and not simply accept that they are requirements. Challenge the process and rule, ensure that the rules have not changed and get evidence of the rule to validate. Perhaps, the current method has waste or the requirements are not being met.
Non-Value-Added:
- Set-ups
- Preparation
- Meetings
- Any of the 7-Wastes
- Inspections (that are not "business or regulatory" requirements
- Not necessary to add value to the product or service
- Customer is not willing to pay for the step
If a process has multiple steps and involves processes at several locations, it is highly likely that the waste of Transportation and Waiting (product not moving while sitting in WIP - especially if you have batch processing) will become alarming apparent as to the overall affect they create on the value stream.
These are usually top contributors to the total non-value added time.
Sometimes paying a little more to save a lot of lead time or reduce other waste is the correct overall decision.
For instance, paying to arrange more frequent tugger routes or truck hauls could significantly reduce lead time (freeing up cash and improving working capital) however it comes at a cost.
It is a business decision depending on which goal is most important and it is the job of the Six Sigma project manager to get that information from the leaders of the company and present it to the team so the right decision can be implemented.
Value Stream Mapping ICONS
 |
Shown below are some of the most common icons used within a VSM. An Excel file with these icons embedded for copying and using for your project can be found by clicking here. |

%20Flow%2C%20and%20the%20final%20section%20at%20the%20bottom%20is%20the%20Lead%20Time%20Ladder.)
Subscribe for complete site access
Recent Articles
-
Process Capability Indices
Oct 18, 21 09:32 AM
 Determing the process capability indices, Pp, Ppk, Cp, Cpk, Cpm
 -
Six Sigma Calculator, Statistics Tables, and Six Sigma Templates
Sep 14, 21 09:19 AM
 Six Sigma Calculators, Statistics Tables, and Six Sigma Templates to make your job easier as a Six Sigma Project Manager
 -
Six Sigma Templates, Statistics Tables, and Six Sigma Calculators
Aug 16, 21 01:25 PM
Six Sigma Templates, Tables, and Calculators. MTBF, MTTR, A3, EOQ, 5S, 5 WHY, DPMO, FMEA, SIPOC, RTY, DMAIC Contract, OEE, Value Stream Map, Pugh Matrix -
Six Sigma, Six Sigma Training, Courses, Calculators, Certification
Aug 15, 21 10:27 PM
 One site with the most common Six Sigma material, videos, examples, calculators, courses, and certification.

Site Membership
LEARN MORE
Six Sigma
Templates, Tables & Calculators
Six Sigma Slides
Green Belt Program (1,000+ Slides)
Basic Statistics
Cost of Quality
SPC
Process Mapping
Capability Studies
MSA
SIPOC
Cause & Effect Matrix
FMEA
Multivariate Analysis
Central Limit Theorem
Confidence Intervals
Hypothesis Testing
T Tests
1-Way ANOVA
Chi-Square
Correlation
Regression
Control Plan
Kaizen
MTBF and MTTR
Project Pitfalls
Error Proofing
Z Scores
OEE
Takt Time
Line Balancing
Yield Metrics
Sampling Methods
Data Classification
Practice Exam
... and more
Statistics in Excel

Need a Gantt Chart?