Six Sigma & Lean Glossary
ADJUSTED R-SQUARED: modification of r-squared used in regression and multiple regression to compare models with different number of explanatory terms. Adjusted R-squared is more useful only if the R-squared is calculated based on a sample not the entire population.
ALPHA-RISK: The maximum risk or probability of making a Type I Error or saying there is a change when there really isn't. Often this is established at 5%, leaving the Level of Confidence at 95%; however it should be agreed upon with the BB or MBB. The alpha-risk is also known as the Significance Level.
ALTERNATIVE HYPOTHESIS (Ha): This statement is inferred if Ho is rejected which means there has been a statistical change or difference (guilty - no longer innocent).
ANALYSIS OF VARIANCE (ANOVA): statistical technique for analyzing experimental data and commonly used two compare >2 means.
ATTRIBUTE DATA: pass/fail or go/no-go information. The control charts based on attribute data include percent chart, number of affected units chart, count chart, count-per-unit chart. Commonly used attribute control charts are also called C,U,P,NP charts.
AVAILABILITY: one of three components used to calculate the Overall Equipment Effectiveness (OEE). Availability can be expressed by the ratio of the uptime divided by the schedule time which is the same as the uptime plus downtime.
BENCHMARKING: comparing a process or product to the others to determine improvement plan. Trying to obtain all similar concepts from worse to best to make decisions on improvements
BLOCKING: Used in design of experiments (DOE) to neutralize background variables that can not be eliminated by randomizing through spreading them across the experiment.
BOX-PLOT: also known as a box and whisker diagram is a graphing tool that displays centering, spread, and distribution of a continuous data set. See Box Plot for more information.
BRAINSTORMING: a technique that teams use to generate ideas on a particular subject. Each person in the team is asked to think creatively and write down as many ideas as possible. The ideas are not discussed or reviewed until after the brainstorming session.
C CHART: count chart for attribute data. See C-Chart for more information.
CAPABILITY INDEX (Cp,Cpk,Pp,Ppk,Cpm) all assume normal data. Pp and Ppk are rarely used compared to Cp and Cpk. They should only be used as relative comparisons to their counterparts
- Cp: a short-term process capability index. The best a process can perform. A function of the standard deviation that numerically describes variation relative to the tolerance or specifications. Used to establish baseline measurement in the Measure phase of a DMAIC project and final score in the Control phase. The Cp is the best a process can perform if that process is centered on the midpoint and the Cp = Cpk.
- Cpk: a short-term process capability index that is a function of the mean and standard deviation, very commonly used.
- Pp: numerically describes the long-term capability (Cp is short term indicator) of a process assuming it was analyzed and stays in control. Similar to Cp, this capability index is only a function of the standard deviation, not a nominal (target) value that may be historical or provided by the customer.
- Ppk: numerically describes the long-term capability. account for centering of the process among the midpoint of the specifications. However, this performance indice may not be optimal if the customer wants another point as the target other than the midpoint. The calculation of Cpm accounts for the addition of a target value.
- Cpm: Cpm is a capability index, also known as the Taguchi capability index, that is a function of the specification limits, mean of the process, sample standard deviation, and a provided target, T.
CAUSE-AND-EFFECT DIAGRAM: a tool for seeking out all the causes, regardless of magnitude, that are contributing to the effect, Y. It is also referred to as the Ishikawa diagram after developer Kaoru Ishikawa and the Fishbone Diagram due to its configuration as the skeleton of a fish. This diagram is one of the seven tools of quality and is one of frequently used subjective screening tools in a DMAIC Six Sigma project.
CENTRAL LIMIT THEOREM: States that given a distribution with a mean and variance, the sampling distribution of the mean approaches a normal distribution with a mean and variance/N as N, the sample size, increases. Also referred to as the Law of Large Numbers in the insurance and risk management field of study.
CHECK SHEET: A "sheet" used to collect real-time data at the location where the data is generated. Data can be of any type and is the first steps to any improvement project which can be either quantitative or qualitative (attribute, discrete, variable, continuous).
CHI-SQUARE TEST: A hypothesis test to determine whether a statistically significant difference exists between two or more independent groups of discrete data, ruling out chance. Used in the ANOVA and CONTROL phase of a DMAIC project to assess baseline and changes.
CLASSIFICATION: A trait such as a defect or failure mode must be classified into a category.
- Location: The physical location of a trait is indicated on a picture of a part or item being evaluated.
- Frequency: The presence or absence of a trait or combination of traits is indicated. Also number of occurrences of a trait on a part can be indicated.
- Measurement: A measurement scale is divided into intervals, and measurements are indicated by checking an appropriate interval.
- Check List: The items to be performed for a task are listed so that, as each is accomplished, it can be indicated as having been completed.
CLUSTER SAMPLING: a sampling of samples collected from each cluster from which a population is divided. A random sample of items from each cluster is collected.
COEFFICIENT OF CORRELATION: that measures only a linear relationship between two variables and is denoted by an "r" value. The "r" value is used to measure the correlation and it will always range from -1.0 (anticorrelation) to +1.0. As the value approaches 0 their is less linear correlation, or dependence) of the variables.
COEFFICIENT OF DETERMINATION: The COD ranges from 0-1 (0%-100%) represented by r-squared. The proportion of variability of the dependent variable (Y) accounted for or explained by the independent variable (x) equal to the coefficient of correlation value squared.
COMMON CAUSES: causes of variation that are inherent in a process over time. They affect every outcome of the process and everyone working in the process. (See also "special causes.")
CONFORMANCE: an affirmative indication or judgment that a product or service has met the requirements of a relevant specification, contract, or regulation
CONTINUOUS IMPROVEMENT: the ongoing improvement of products, services, or processes through incremental and breakthrough improvements. Kaizen blitzes are burst of high intensity, quick, and relatively inexpensive improvements
CONTROL CHART: a chart with upper and lower control limits on which values of some statistical measure for a series of samples or subgroups are plotted. The chart frequently shows a central line to help detect a trend of plotted values toward either control limit, the LCL or UCL.
CONTROL LIMIT: control limit for points above the central line in a control chart. There is a lower control limit (LCL) and an upper control limit (UCL) and this is provided by the process where as the specification limits (used in process capability assessments) are provided by the customer.
CORRELATION: measures the relationship of the inputs (x) on the output (y) of a process. It is the degree or extent of the relationship between two variables. Correlation studies are used to see if there is a predictive relationship of the input on the process. Linear correlation has value of "r" between -1.0 and +1.0.
COROLLARY: An inference derived from axioms or propositions that follow from axioms or other proven propositions.
CORRECTIVE ACTION: the implementation of solutions resulting in the reduction or elimination of an identified problem.
CRITICAL TO QUALITY (CTQ): key measurable characteristics of a product or process whose performance standards, or specification limits, must be met in order to satisfy the customer. Sought in the DEFINE phase of Six Sigma projects as a part of gathering the Voice of the Customer (VOC). They align improvement or design efforts with critical issues that affect customer satisfaction.
CUMULATIVE SUM CONTROL CHART: a control chart on which the plotted value is the cumulative sum of deviations of successive samples from a target value. The ordinate of each plotted point represents the algebraic sum of the previous ordinate and the most recent deviations from the target
CUSTOMER DELIGHTER: delighter features are used in Kano Model that are characteristics that pleasantly surprise and exceed customer expectations.
CUSTOMER SATISFACTION: the result of delivering a product or service that meets customer requirements also known as the Voice of the Customer.
DEFECT: a non-conforming characteristic for a product, process, or service. A defective unit may have one or more defects.
- Class 1 = Very Serious
- Class 2 = Serious
- Class 3 = Major
- Class 4 = Minor
Causes that have higher lower class of defect are often given higher subjective scores relative to their impact on the effects. Such as "severity" scoring within the FMEA creation process.
FACTOR: also known as a predictor variable (x, PIV). This input variable may be controlled or uncontrolled variable whose influence is being studied.
F-DISTRIBUTION: The F-value is a measurement of distance between individual distributions. As F goes up, P goes down saying that there is more confidence in there being a difference between two means and to accept the alternative hypothesis. To calculate take the Mean Square of X divided by the Mean Square of Error Compare this value to the F-critical value found in a table is another way to test hypothesis used in ANOVA.
FIT: Predicted value of the response variable provided a specific combination of factor settings.
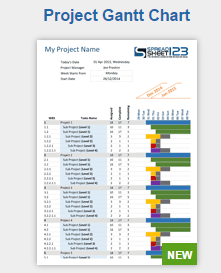
GANTT CHART: Visual project planning device used for production scheduling. It is a horizontal bar chart that serves as a visual tool for project management. It illustrates dependent steps and where the project is at any given time. The chart was developed by Henry Laurence Gantt, born in 1861.
GEMBA: Japanese word commonly used in Lean Manufacturing meaning "the actual place" which is intended to mean "go and see the actual process where the value is created" as opposed to sitting at a desk and making assumptions.
JIDOKA: Japanese term commonly used in Lean Manufacturing which means to build in automated quality systems to detect variation and abnormalities.
JUDGMENT SAMPLE: sample selected based on personal judgment.
KURTOSIS: measure of peakness or flatness of a distribution.
LINEARITY: Variation between a known standard across the low and high end of the gage. It is the difference between an individual's measurements and that of a known standard or truth over the full range of expected values.
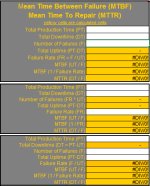
MEAN TIME BETWEEN FAILURES (MTBF): common metric used in Predictive Maintenance programs. It measures the average amount of time between failures for a machine or product. See our calculator here (and many more)
MULTICOLLINEARITY: when two or more predictor variables (x, input variables) are found to be correlated with each other.
NOMINAL GROUP TECHNIQUE: a brainstorming technique used by teams to generate ideas. Team members are asked to confidentially write down as many ideas as possible. Each member is then asked to share one idea with the rest of the team which is recorded. Once everyone on the team has shared an idea, the ideas are prioritized by the entire group.
NULL HYPOTHESIS (HO): statement of no change or difference. The HO is assumed true (innocent) until sufficient evidence is presented to prove it different (guilty) and then the Alternative Hypothesis (HA) is inferred.
OPPORTUNITY COST (or LOSS): loss incurred by not making the best decision possible.
POISSON: Poisson formula describes rare events and is also referred to as the law of improbable events. The formula is shown below to calculate the probability of occurrences over an interval. It can provide an approximation to the Binomial Distribution if the number of samples (n) is large and probability of a success (p) is small. Click here to visit the module on the Poisson Distribution.
The Poisson Distribution is a discrete distribution named after French mathematician Simeon-Denis Poisson.
Unlike the Binomial Distribution that has only two possible outcomes as a success or fail, this distribution focuses on the number of discrete occurrences over a defined interval.
POPULATION: composes the entire set of observations that one is observing. It is very rare to observe an entire finite population; and if so, estimates are not needed such as point estimates, confidence intervals, and related Type I and II error.
POWER: The ability for a statistical test to detect a difference when one really exists.
R-SQUARED: The amount of variation explained by the regression equation. Used in inference space to predict future outcomes on the basis of other related information. It is the sum of the squares of the regression model divided by total sum of squares. The square root of it is the correlation coefficient, r.
REGRESSION: Provides an equation describing the nature of relationship such as y = mx + b. Multiple regression is used to understand the relationship between a dependent variable and numerous independent variables.
RESIDUAL: Difference between an actual and fitted (predicted) experimental value. Term commonly found when using regression or multiple regression. This represents the error in the fit of regression line and is difference between the observed value of response variable and best-fit value.
RESPONSE VARIABLE (Y, KPOV): process output. This is linked to the customer Critical To Quality (CTQ) characteristics.
ROLLED THROUGHPUT YIELD (RTY): The probability of the entire process producing zero defects. RTY is more important as a metric to use where the process has excessive rework. RTY is the product of each process’s throughput yield, TPY.
SAMPLE: a collection of observations that make us a portion of the population.
SEVEN TOOLS OF QUALITY: commonly used tools in just about every DMAIC Six Sigma project to help understand an existing process and drive most effective improvements.
- Fishbone diagram (finding the all the root causes)
- Check sheet (collecting data)
- Flowchart (Process Map-what is really happening)
- Control chart (determining the initial and final state of process)
- Histogram (determining the data distribution)
- Pareto chart (finding the vital few)
- Scatter diagram (for correlation/regression)
SHEWHART CYCLE: named after father of statistical control and creator of the control chart, Walter Shewhart. Also called "plan-do-check-act cycle", or PDCA cycle, or PDSA cycle representing "plan-do-study-act".
SIGNAL-TO-NOISE (S/N) RATIO: a mathematical equation that indicates the magnitude of an experimental effect above the effect of experimental error due to chance fluctuations.
SIGNIFICANCE LEVEL - This is the alpha-risk.
SIX-SIGMA QUALITY: a term used to generally indicate that a process is well within specifications or has received "perfection". Process can be better than six-sigma. Technically the specification range is ±6 standard deviations.
SPEARMAN'S RHO CORRELATION COEFFICIENT: Similar to Pearson's Correlation Coefficient (r) it is a measure of statistical dependence of two variables in matched pairs. It is a non-parametric test that will also have a value range from -1 to +1 and zero indicating no association. Spearman's Rho test can determine association of non-linear relationships but it has its limitations too. Recall the Pearson's Correlation Coefficient only measures linear correlation.
A value of +1 indicates perfectly positive monotonic correlation. All data points with greater x values than that of a given data point will have greater y values.
A value of 0 indicates no correlation.
A value of -1 indicates perfectly negative monotonic correlation. All data points with lower x values than that of a given data point will have lower y values.
SPC: Statistical Process Control
SPECIAL CAUSES: causes of variation that arise because of non-inherent and special circumstances. Special causes are also referred to as assignable causes that will result initially a process being out of control. Not all special causes are found outside of the process control limits. Two types of variation: common cause and special cause
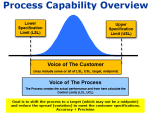
SPECIFICATION: a document or customer provided evidence that states the requirements to which a given product or service must conform. Commonly found as the lower specification limit (LSL) and/or the upper specification limits (USL). Customer may also provide a target that may or may not be in the middle of the LSL and USL. These are part of the Voice of the Customer (VOC).
STABILITY: represents variation due to elapsed time. It is the difference between an individual's measurements taken of the same parts after an extended period of time using the same techniques.
STEM AND LEAF PLOT: Graphical plot used to display in a bar chart format categories or variable data. The stems are groups of data by class intervals. The leaves are smaller increments of each data point that are built onto the stems.
TAGUCHI LOSS FUNCTION: An equation that measures the “loss” experienced by customers as a function of how much a product varies from what the customer finds useful.
TAKT TIME: The rate at which products or services should be produced to meet the customer demand. The value, in conjunction with current loading (production) rates, is used to analyze process loads, bottlenecks, and excess capacity. Click here to see the module on Takt Time.
THROUGHPUT YIELD (TPY): The number of acceptable pieces at the end of the end of a process divided by the number of starting pieces excluding scrap and rework (meaning they are a part of the calculation).
TYPE I ERROR: Alpha risk. The chance of the “false positive” or "Producers Risk. Detecting a difference when there actually isn't a difference (scrapping good parts)
TYPE II ERROR: Beta risk. The chance of a “false negative”, "Consumers Risk". The risk of not detecting a difference when there actually is. Passing parts that are actually defective.
U CHART: count per unit chart used with attribute data.
VALUE-ADDED: Process steps or activities that add value to the customer or satisfy some need according to the Voice of the Customer. These steps may also be lawfully required or done to meet other regulatory requirements. A value-added process must be done right the first time (a rework of the same step is waste).
WASTE WALK: a physical walk or review (GEMBA) of a process to look for and identify any of the 7 Wastes. These are opportunities to IMPROVE

Site Membership
LEARN MORE
Six Sigma
Templates, Tables & Calculators
Six Sigma Slides
Green Belt Program (1,000+ Slides)
Basic Statistics
Cost of Quality
SPC
Process Mapping
Capability Studies
MSA
SIPOC
Cause & Effect Matrix
FMEA
Multivariate Analysis
Central Limit Theorem
Confidence Intervals
Hypothesis Testing
T Tests
1-Way ANOVA
Chi-Square
Correlation
Regression
Control Plan
Kaizen
MTBF and MTTR
Project Pitfalls
Error Proofing
Z Scores
OEE
Takt Time
Line Balancing
Yield Metrics
Sampling Methods
Data Classification
Practice Exam
... and more
Statistics in Excel
Need a Gantt Chart?


