|
 content.")

A3 Problem Solving Tool
The A3 methodology is problem solving tool first introduced by Toyota and is more than a root cause indicator such as a Fishbone Diagram. Toyota's goal was to capture the problem, the analysis, corrective actions and tracking of action plans all onto one sheet of paper.
The A3 name comes from the size of the paper. It's an international term for paper measuring 297 mm wide by 420 mm in length. The closest paper size commonly used in the United States is 11"*17".
The A3 is considered a problem solving tool that was widely used at Toyota to standardize and simply communication. In many cases it is used as problem solving tool that generally applies subjective analysis.
The A3 format is designed to have all the following on this one sheet of paper:
- Problem identification
- Clarification
- Analysis
- Resolution

A3 is a key component of Toyota problem solving process based on the PDCA cycle. It applies to all levels of the workforce. The Plan-Do-Check-Act cycle is fully encompassed in this tool from the scope to sustaining the gains and spreading them company wide.
It is a communication tool for workers to report problems and gain support to address issues and fix them. For that reason, the A3 is often created by hand and posted in highly visible area. The A3 progress is typically reviewed (during audits or GEMBA walks) on a daily basis. It takes time to complete the tool, it isn't intended to be done in one sitting.
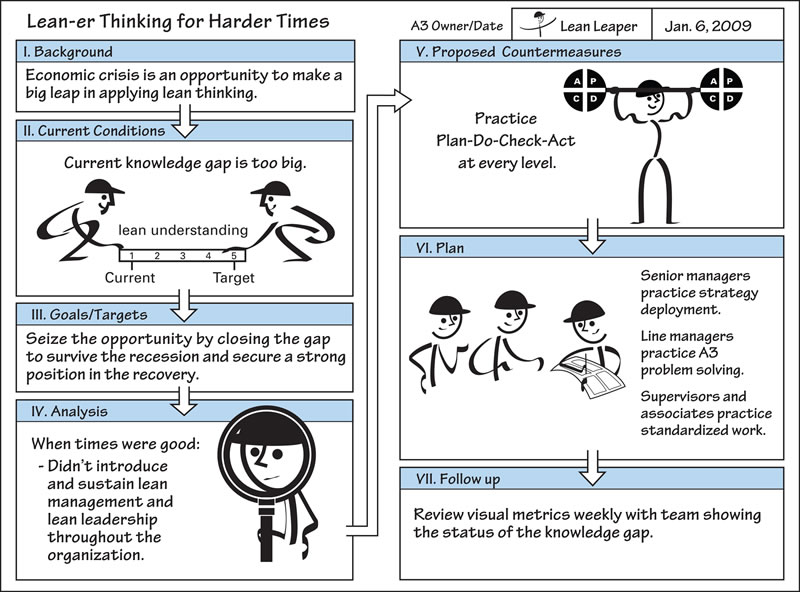
Structure
There are several variations of the flow within the sheet. Exactly how each sheet of paper may look, the tools used, depends on the problem. The general flow is show below however the most important thing is to capture the key relevant information, in sequential flow, on the paper...the exact location on the paper isn't as important.
Left Side of A3 - PLAN
Top Left Corner: Similar to a Project Charter. A background and statement of the current state along with a problem statement. A statement about the objective and desired final state.
Bottom Left Corner: Support data such as Pareto Diagrams, Box Plots, Spaghetti Diagrams, Process Map, Time-Series Plot. The subjective root cause analysis usually involving a Fishbone Diagram and possible simple C&E Matrix and FMEA. Also possible use of the 5-Why methodology.
Right Side of A3 - DO / CHECK / ACT
Upper Right Corner: Action register with accountability and dates. Answer the who, what, when, where, and how.
Lower Right Corner: A measurement plan to verify the results and check them to ensure goals are met. Also a plan to sustain the gains and implement gains to other areas of the company.
 A3 at Six-Sigma-Material.com
A3 Template
|
|
Download this free .zip file for an A3 template in Excel. |
More Templates, Tables, and Calculators
Return to the Six-Sigma-Material.com home page
Recent Articles
-
Process Capability Indices
Oct 18, 21 09:32 AM
 Determing the process capability indices, Pp, Ppk, Cp, Cpk, Cpm
 -
Six Sigma Calculator, Statistics Tables, and Six Sigma Templates
Sep 14, 21 09:19 AM
 Six Sigma Calculators, Statistics Tables, and Six Sigma Templates to make your job easier as a Six Sigma Project Manager
 -
Six Sigma Templates, Statistics Tables, and Six Sigma Calculators
Aug 16, 21 01:25 PM
Six Sigma Templates, Tables, and Calculators. MTBF, MTTR, A3, EOQ, 5S, 5 WHY, DPMO, FMEA, SIPOC, RTY, DMAIC Contract, OEE, Value Stream Map, Pugh Matrix -
Six Sigma, Six Sigma Training, Courses, Calculators, Certification
Aug 15, 21 10:27 PM
 One site with the most common Six Sigma material, videos, examples, calculators, courses, and certification.

Site Membership
LEARN MORE
Six Sigma
Templates, Tables & Calculators
Six Sigma Slides
Green Belt Program (1,000+ Slides)
Basic Statistics
Cost of Quality
SPC
Process Mapping
Capability Studies
MSA
SIPOC
Cause & Effect Matrix
FMEA
Multivariate Analysis
Central Limit Theorem
Confidence Intervals
Hypothesis Testing
T Tests
1-Way ANOVA
Chi-Square
Correlation
Regression
Control Plan
Kaizen
MTBF and MTTR
Project Pitfalls
Error Proofing
Z Scores
OEE
Takt Time
Line Balancing
Yield Metrics
Sampling Methods
Data Classification
Practice Exam
... and more
Statistics in Excel

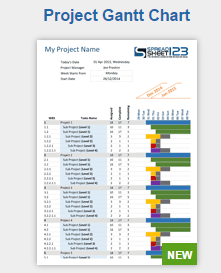
Need a Gantt Chart?